Monitoring SLE HPC 15 with Prometheus and Grafana
While developing SUSE Linux Enterprise HPC 15 SP2, we have been working on adding new monitoring possibilities for our HPC product. As HPC systems monitoring has evolved, lately there has been a tendency to use the same system to monitor all company resources. This is where applications like Prometheus have become increasingly omnipresent, especially in the cloud.
Prometheus is a monitoring system, different from traditional monitoring systems where the clients push their data to the server. Instead, Prometheus scrapes the metrics exported over HTTP from every client. All this data is placed in a time series database that can be queried using its own functional query language called PromQL. Prometheus databases can be read by Grafana, a tool for interactive visualization of data, allowing creation of beautiful data dashboards.
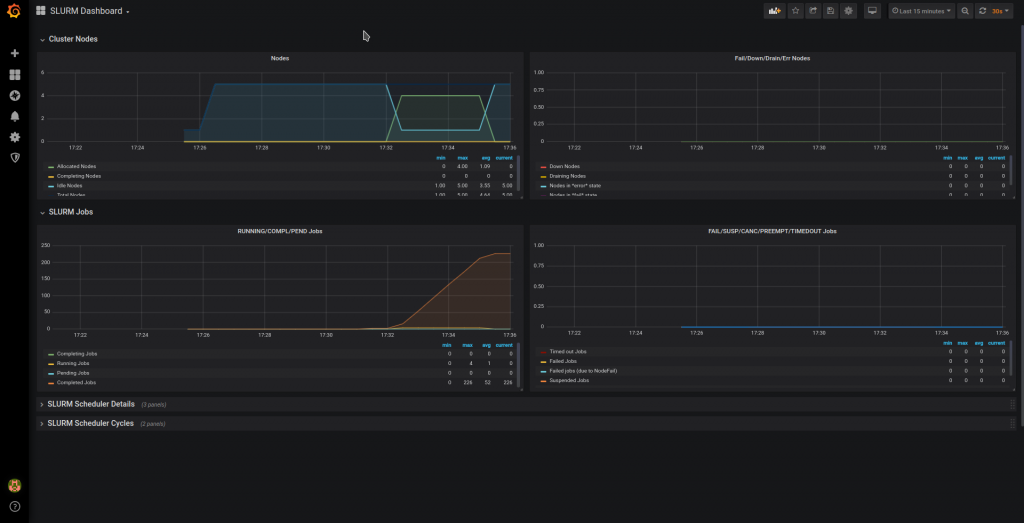
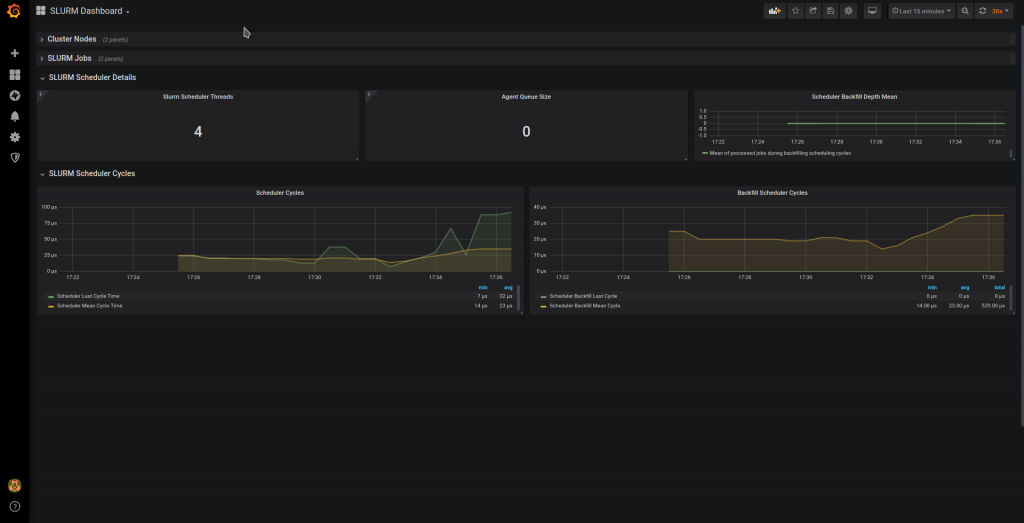
One of the many third party metrics exporters for Prometheus is the Prometheus exporter for performance metrics of SLURM, which allows the user to get metrics from the SLURM workload manager, which is widely used in HPC. Together with its Grafana dashboard, it creates visualizations like this:
Installing Prometheus, the SLURM exporter and Grafana
To install Prometheus and Grafana, you’ll need to enable the backports provided by PackageHub. Since PackageHub is still not available for SLE 15 SP2, we’ll enable PackageHub for SLE 15 SP1 and add the backports repository manually. Please follow these steps on the systems where you wish to install Prometheus, Grafana and where the SLURM controller slurmctld is running:
# SUSEConnect --product PackageHub/15.1/x86_64
# zypper ar https://download.opensuse.org/repositories/openSUSE:/Backports:/SLE-15-SP2/standard/openSUSE:Backports:SLE-15-SP2.repo
# zypper refresh
Then install the SLURM Prometheus exporter in the server where slurmctld is running:
# zypper in golang-github-vpenso-prometheus_slurm_exporter
# systemctl enable --now prometheus-slurm_exporter
The IP addresses used in these examples are in the 10.0.100.0 network. For example, the SLURM Server is using the IP 10.0.100.2. Remember to change the IP address in the examples to the one your system is using! The same applies for the system with Prometheus and Grafana, in this example using the IP 10.0.0.3. It’s possible however to install everything on the same system.
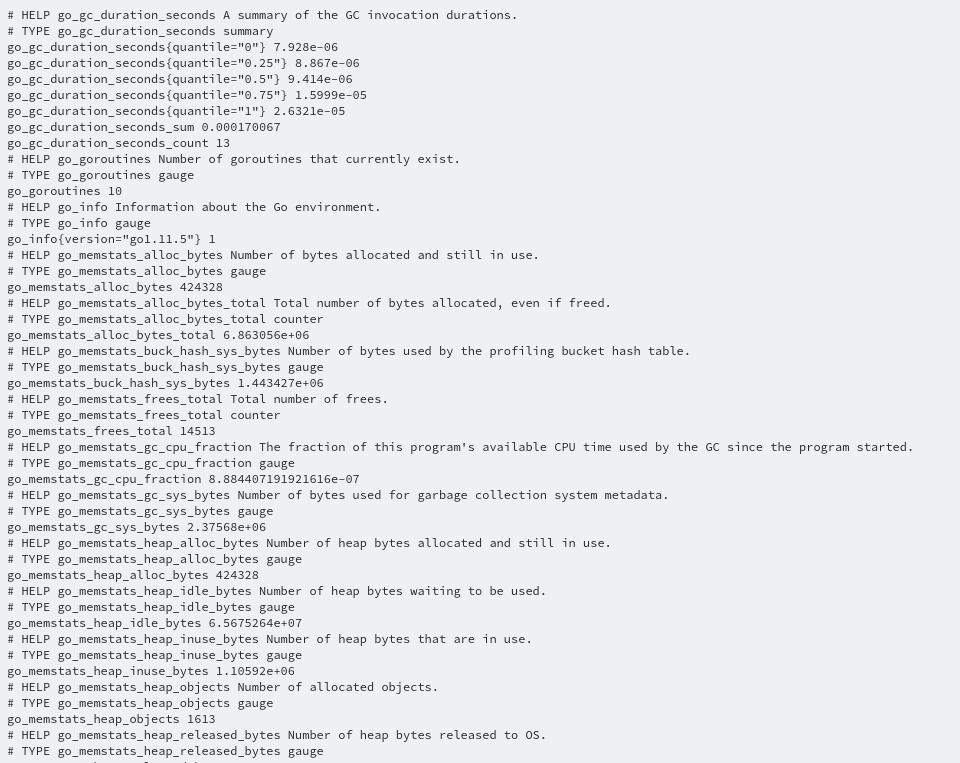
Then, point your browser to http://10.0.100.2:8080/metrics, and if everything worked fine, you’ll see the exported metrics to be collected by Prometheus:
Now we’ll install Prometheus and Grafana on the system we want to use as the monitoring server:
# zypper in golang-github-prometheus-prometheus grafana
Before starting Prometheus, we need to edit its configuration file /etc/prometheus/prometheus.yml and make it look like this:
global:
  scrape_interval:     15s # By default, scrape targets every 15 seconds.
  evaluation_interval: 15s # By default, scrape targets every 15 seconds.

rule_files:

scrape_configs:

  - job_name: 'prometheus-server'
    # Override the global default and scrape targets from this job every 5 seconds.
    scrape_interval: 5s
    scrape_timeout: 5s
    static_configs:
      - targets: ['localhost:9090']


  - job_name: 'slurmctld'
    static_configs:
      - targets: ['10.0.100.2:8080']
The first job ‘prometheus_server’ is used to monitor the Prometheus server itself, and the second job ‘slurmctld’ is for the SLURM exporter metrics.
And finally, we enable and start Prometheus and Grafana:
# systemctl enable --now prometheus
# systemctl enable --now grafana-server
Now you should be able to open http://10.0.100.3:9090/config in your browser and get the same YAML file shown in the screen from the Prometheus web interface.
It’s time to configure Grafana. Point your browser to http://10.0.100.3:3000 and use the user “admin” with the password “admin” to login for the first time.
The next step is to install the Grafana dashboard for the SLURM exporter from your Home Dashboard in Grafana:
- Click “Add data source” and select “Prometheus”. Given the Prometheus and Grafana servers are in the same host, set the URL to http://localhost:9090 and click “Save & Test”.
- Click “New dashboard”, in the next screen click again in “New dashboard” and select “Import dashboard”. You’ll get the option to paste a grafana.com dashboard url or id. To import this SLURM Dashboard use its number 4323 and click “Load”.
On the following screen, select “Prometheus” from the “Select a Prometheus data source” drop down menu and click “Import”
If everything went fine, you’ll be shown a SLURM dashboard in the browser similar to the ones shown in the beginning of this post. The visualization will be more interesting if you’re using a real SLURM server in production!
Monitoring all the compute nodes
Once you have installed Prometheus and Grafana, you can consider monitoring all your computer nodes. While SLURM already can provide some metrics as part of its job status information, the Prometheus Node Exporter can give you more metrics about your nodes.
All you need to do in your SLES nodes is install the basic node exporter provided by the package golang-github-prometheus-node_exporter that is included in SLE 15 already, and enable it with the commands:
# zypper in golang-github-prometheus-node_exporter
# systemctl enable --now prometheus-node_exporter
The metrics will be available from port 9100.
For this example, you can install the node exporter in both systems running slurmctld and prometheus.
The next step is updating the configuration file of Prometheus /etc/prometheus/prometheus.yml:
...snip...

scrape_configs:

  - job_name: 'prometheus-server'
    # Override the global default and scrape targets from this job every 5 seconds.
    scrape_interval: 5s
    scrape_timeout: 5s
    static_configs:
      - targets: ['localhost:9090']
      - targets: ['localhost:9100']


  - job_name: 'slurmctld'
    static_configs:
      - targets: ['10.0.100.2:8080']
      - targets: ['10.0.100.2:9100']
In both jobs, a new line has been added for the node exporter data served from port 9100 .
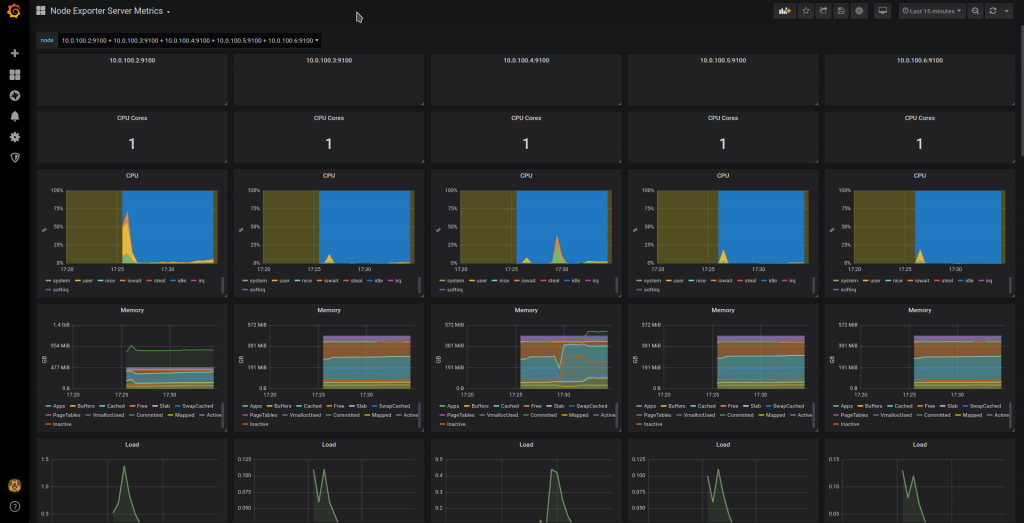
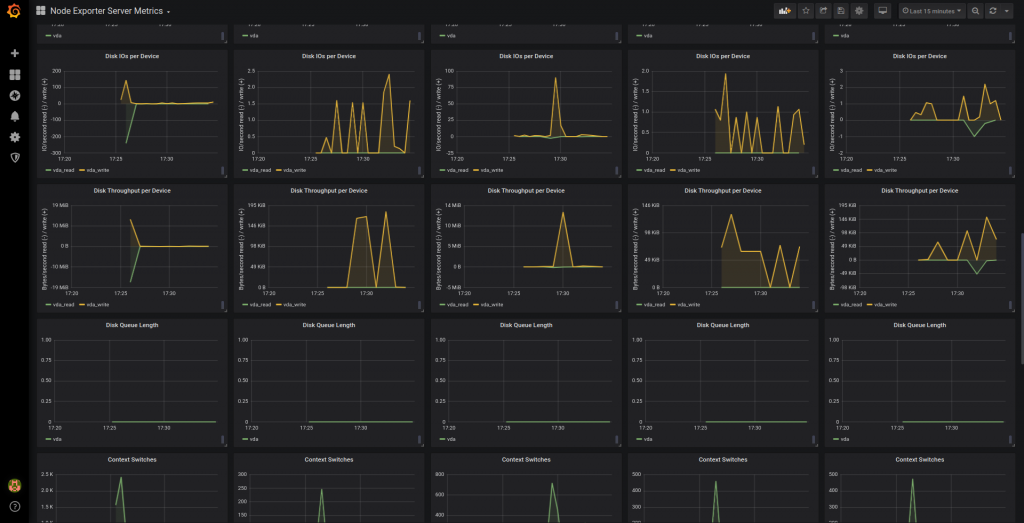
The final step is adding the grafana dashboard for Node Exporter following the same steps outlined above. The resulting dashboards will be similar to these:
Related Articles
Aug 13th, 2024
saptune 3.1.3 – Minor Fixes and a Note Update
Nov 11th, 2025
No comments yet