Troubleshooting SLES VM Memory Issues
This document describes how to troubleshoot SLES Virtual Machine’s memory issues quickly to get ahead of problems and avoid bigger issues.
When we use a lot of VM’s it’s pretty hard to monitor their health in the ESX level. If we are lucky maybe we have access to vSphere to see the status. Yes I know: in large implementations each vendor is responsible for their products, in this case VMWare.
But it is important that we have a close knowledge about the VM’s health (notice I said VM not SO). There are many things that can cause problems. This time we’ll talk about: Memory issues.
VMWare has a tool (?) called Memory Balloon, and basically it helps protect the ESX when it is close to running out of physical memory. The “Balloon” inflates to avoid VM’s using more RAM and this keeps the ESX safe.
http://www.vmware.com/files/pdf/perf-vsphere-memory_management.pdf
In a common scenario, where we don’t have admin privileges, we can look the balloon behavior from the vSphere in the Performance Charts, but unless you are constantly looking at those stats you can’t know in real time if balloon memory is activated.
Then, how we can know when the Memory Balloon is activated? I made a little troubleshooting tool to help find the answer.
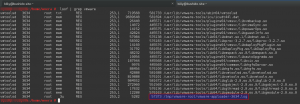
- What is using for VMware?
# lsof | grep vmware
- A log file? sweet!
# cd /tmp/vmware-root; head $(ls -tr | tail -1)
- So easy? Is that really possible? Let’s try!
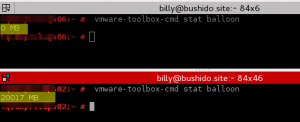
# vmware-toolbox-cmd stat balloon
Bingo!
Since a Memory Balloon works with an agent (vmmemctrl driver in Linux) we can determine: 0 MB == Disable and vice versa.
Example 1: Memory Balloon disabled.
Example 2: Memory Balloon Active and reserving 20017 MB of RAM!
Check: vmware-toolbox-cmd help stat for more useful options of this tool.
Now what? Why is it useful to know this?
Because if we are using a VM in a large implementation, we probably have a lot of “neighbors” in the same ESX. And with so many ESX admins trying to manage their resources in the best possible way, they don’t “open” all the resources assigned to the VM.
For example, I have a VM that we think has 32GB of RAM. In the SO, if we check:
/proc/meminfo

free

top
…maybe we can see our memory assigned. But if we run:
# vmware-toolbox-cmd stat memlimit
…and there is a difference, then we have a problem. It could mean that the ESX admin has limited our memory to less than we have assigned.
Now imagine if we know that we “have” 32GB of RAM assigned to us, and we are running Apache and Java services, and we tune them based on having 32GB of RAM… but really in ESX we are limited to 16GB (for example) and at this moment, our “neighbors” are using a lot of RAM and Memory Balloon activates with 8GB of RAM!
Then we are talking about 8GB of REAL Memory and we still think that have 32GB.
Crazy, right? So now imagine that we can’t know this (since this occurs in the backend), how you can troubleshoot this at the SO level?
This is why is very important to know how to check those settings.
Conclusion:
In the perfect world
vmware-toolbox-cmd stat memlimit
must be matched with the SO memory.
vmware-toolbox-cmd stat balloon
must be in zero.
By keeping an eye on this, we can avoid many headaches.
So, maybe we can not only avoid ESX issues but knowing this we can stay one step ahead!
PLUS: With vmware-toolbox-cmd also we can troubleshooting CPU issues.
I hope you find it useful!
Related Articles
Oct 24th, 2022
Joining the ALP experience: documentation goes modular
Apr 03rd, 2023


No comments yet