Deploy & Configure NeuVector prometheus-exporter on Openshift 4
In this post we will explain how to monitor and integrate NeuVector with OpenShift monitoring (alert manager) using NeuVector prometheus-exporter
Enable monitoring for user-defined projects in OpenShift 4
You can follow detailed steps at Enabling monitoring for user-defined projects
- Edit the cluster-monitoring-config ConfigMap object:
$ oc -n openshift-monitoring edit configmap cluster-monitoring-config
- Add “enableUserWorkload: true” under “data/config.yaml” :
apiVersion: v1

kind: ConfigMap

metadata:

 name: cluster-monitoring-config

 namespace: openshift-monitoring

data:

 config.yaml: |

 enableUserWorkload: true
Deploy Neuvector Prometheus exporter
-
- Edit the file nv_exporter.yml and change the secret value to match your Neuvector deployment
Variable Description `CTRL_API_SERVICE` NeuVector controller REST API service endpoint `CTRL_USERNAME` Username to login to controller REST API service `CTRL_PASSWORD` Password to login to controller REST API service `EXPORTER_PORT` The port that the export is listening on edit the following section
# Use secrets for things which are actually secret like API keys,

# credentials, etc

# echo -n 'admin' | base64

apiVersion: v1

kind: Secret

metadata:

 name: nv-exporter-secret

type: Opaque

data:

 CTRL_USERNAME: YWRtaW4=

 CTRL_PASSWORD: cGFzc3cwcmQ=
- Apply the exporter nv_exporter.yml after your changes on your OpenShift cluster
$ oc apply -f nv_servicemonitor.yml
- Apply the service monitor nv_servicemonitor.yml on your OpenShift cluster
$ oc apply -f nv_servicemonitor.yml
Deploy Neuvector Prometheus Rule
- Now the last thing is to create the needed alerts to monitor different components of NeuVector.
For example the following snippet create an alert rule to monitor if an enforcer is down
apiVersion: monitoring.coreos.com/v1

kind: PrometheusRule

metadata:

  name: neuvector-monitoring

  namespace: neuvector

spec:

  groups:

    - name: neuvector

      rules:

        - alert: neuvectorEnforcerDown

          annotations:

            description: 'Enforcer members are down.'

            summary: Enforcer members are down.

          expr: |-

              max without (endpoint) (sum without (instance) (up{job=~".*neuvector.*"} == bool 0)) > 0

                or

              (nv_summary_hosts{job=~".*neuvector.*"} / ignoring(group,instance,pod,job) nv_summary_enforcers{job=~".*neuvector.*"}) != 1

          for: 5m

          labels:

            severity: critical
- Apply the PrometheusRule nv_alerts.yml on your OpenShift cluster
$ oc apply -f nv_alerts.yml
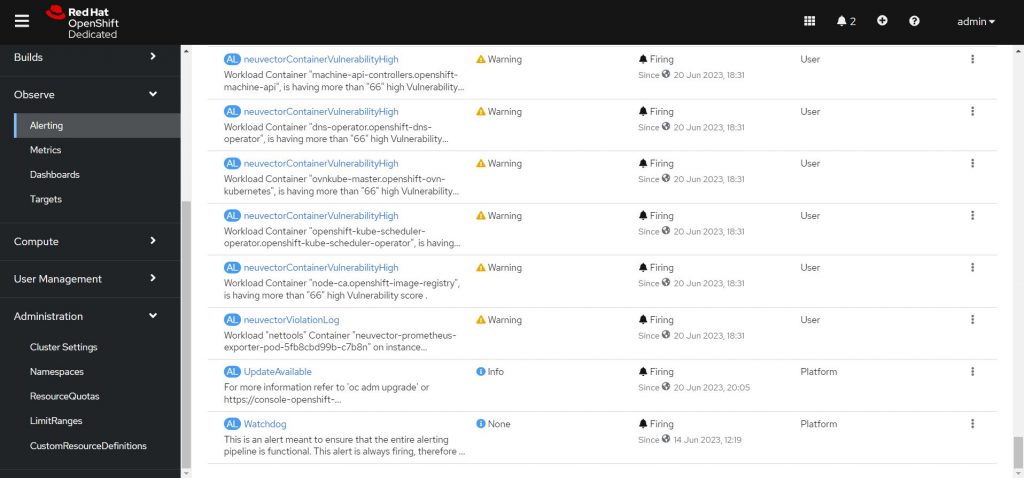
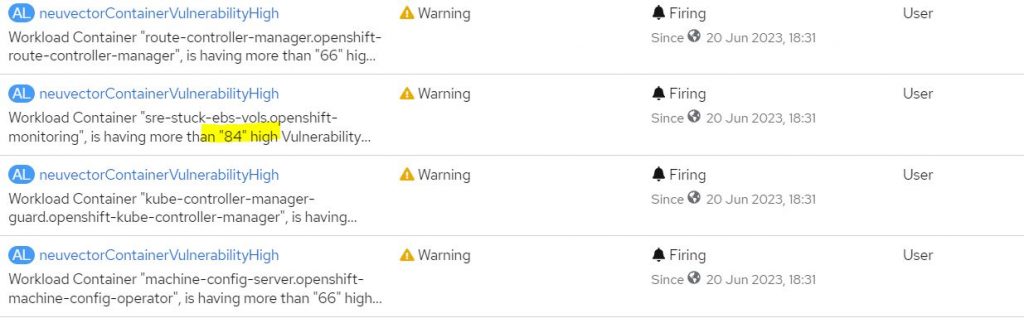
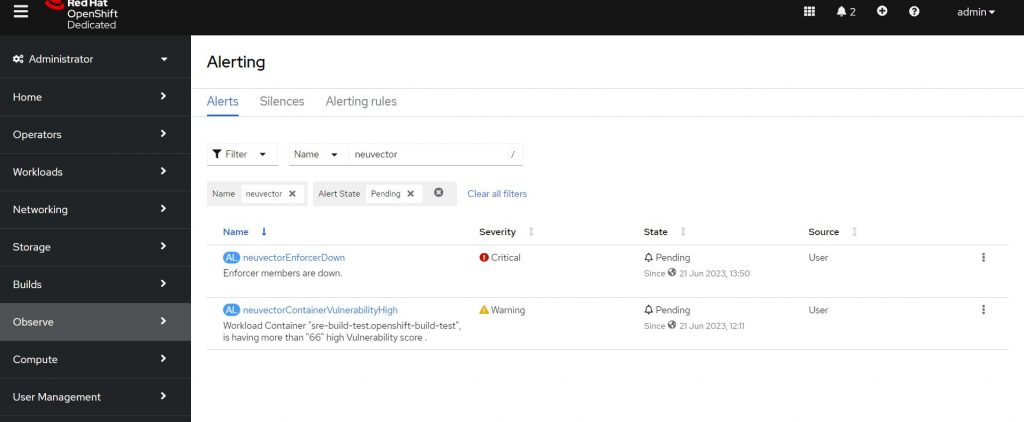
- After that you should see Alerts firing or Pending in Observe | Alerting
References :
- Edit the file nv_exporter.yml and change the secret value to match your Neuvector deployment
Conclusion
In this post we explained how to monitor and integrate NeuVector with OpenShift monitoring (alert manager) using NeuVector prometheus-exporter, and also to fire alerts when needed.
If you want to learn more about NeuVector and Zero-Trust, please feel free to download our free Zero Trust Container Security for Dummies ebook, join one of the NeuVector Rodeos or request a demo of NeuVector.
For more information about our products and services, please dont hesitate to contact us.
(Visited 67 times, 1 visits today)
Related Articles
4,624 views