The Treasure Hunting goes on: “Collecting saptune Data with Prometheus”
Three weeks ago my colleague Bernd Schubert published a blog post about Discover the hidden treasure.
This one is sort of a follow-up and describes, how to use the textfile.collector to retrieve data from saptune.
I recommend to read his blog post first, because I’ll not explain everything in all details.
“Wait!”, I hear you say. “Isn’t there SUSE/saptune_exporter for that?”
And right you are. But this exporter does not work well with the saptune v3. In version 3 we added a lock to prevent multiple saptune processes from running at the same time, since this can cause corrupted tuning. Unfortunately the saptune-exporter is doing exactly that: Starting multiple saptune processes in parallel.
So for the time being, you can use the following to collect saptune data.
What I describe here, is not meant as a complete out-of-the box solution, but an idea how things can be done. Fell free to use and modify it to your needs!
Configuring Prometheus node_exporter
First you need to configure the textfile.collector by editing /etc/sysconfig/prometheus-node_exporter. I use the same target directory for the *.prom files as Bernd, so you can use the same directory for all the files the node exporter shall collect:
# cat /etc/sysconfig/prometheus-node_exporter
...

ARGS="... --collector.textfile.directory="/var/lib/node_exporter/""
After creating the directory and restarting prometheus-node_exporter.service, we are ready for the next step.
The Collector Script
To retrieve the saptune data and present it in a way Prometheus can digest it, I have written a small shell script saptune_collector.sh. Feel free to adapt it to your needs. I suggest to place it into /usr/local/sbin/.
And don’t forget to set the execute permissions! 😉
If you call it now, depending on your saptune configuration you get either a very long output like this:
myhost:~ # saptune_collector.sh
# HELP sc_timestamp Timestamp (epoch) when metrics were generated.
# TPYE sc_timestamp counter
sc_timestamp 1647444034

# HELP sc_saptune Version information of saptune.
# TPYE sc_saptune gauge
sc_saptune{version="3",package="saptune-3.0.2-8.22.2.x86_64"} 1

# HELP sc_saptune_note_enabled Lists all available Notes and if they're enabled by a solution (1), enabled manually (2), not enabled at all or reverted (0).
# TYPE sc_saptune_note_enabled gauge
sc_saptune_note_enabled{note_desc="Indexserver Crash During Startup due to Insufficient Shared Memory Segment",note_id="2534844"} 1
sc_saptune_note_enabled{note_desc="TCP/IP: setting keepalive interval",note_id="1410736"} 0
sc_saptune_note_enabled{note_desc="SAP HANA DB: Recommended OS settings for SLES 15 / SLES for SAP Applications 15",note_id="2684254"} 1
sc_saptune_note_enabled{note_desc="Linux: User and system resource limits",note_id="1771258"} 1
...
The output is very long, but also you can get a rather short one, like this:
myhost:~ # saptune_collector.sh
# HELP sc_timestamp Timestamp (epoch) when metrics were generated.
# TPYE sc_timestamp counter
sc_timestamp 1647444080
# HELP sc_saptune Version information of saptune.
# TPYE sc_saptune gauge
sc_saptune{version="2",package="saptune-2.0.3-8.11.1.x86_64"} 1
Such a short one mostly means, that you have an incompatible saptune version installed. The script only works with version 3 of saptune!
If you get nothing at all, I assume the script itself dies prematurely. Check the exit codes. A list of their meaning is at the beginning of the script.
Repetition, Repetition, Repetition!
Now we need to configure the regular execution of that script to create the data, the node_collector will collect.
For this we need a systemd service and timer.
# cat /etc/systemd/system/saptune_collector.service
[Unit]
Description=Collects saptune metrics for prometheus textfile collector.

[Service]
Type=oneshot
ExecStartPre=/usr/bin/rm -f /var/lib/node_exporter/saptune.prom
ExecStart=/bin/sh -c 'exec /usr/local/sbin/saptune_collector.sh > /var/lib/node_exporter/saptune.prom.tmp'
ExecStartPost=/usr/bin/mv /var/lib/node_exporter/saptune.prom.tmp /var/lib/node_exporter/saptune.prom
A quick walk-through.
First the old data file gets deleted. This makes it easier to spot issues with the collector script. If the metrics are missing, something is wrong. Otherwise Prometheus would collect stale information and only the timestamp would tell.
Then the `saptune` metrics are written to stdout and get redirected to a temporary file first. Afterwards the data file gets renamed. This ensures, that you have either the old data or the new one. It should not happen, that Prometheus collects a half-written file.
I agree, that is a rare event, but better be prepared! In my experience, if you dismiss an event as unlikely, for some reason, it definitely will hit you. Must be universal constant of sorts.
# cat /etc/systemd/system/saptune_collector.timer
[Unit]
Description=Periodic collection of saptune metrics for prometheus textfile collector.

[Timer]
Unit=saptune_collector.service
OnCalendar=*:0/15
RandomizedDelaySec=10

[Install]
WantedBy=timers.target
I call the collector script every 15 minutes here. Adjust this to your needs, but don’t call it to often! The script calls saptune note verify to check if everything is fine. Depending on your system, this can take a few seconds up to minutes.
After enabling the timer, with systemctl daemon-reload ; systemctl enable –now saptune_collector.timer the file /var/lib/node_exporter/saptune.prom should be created and updated regular.
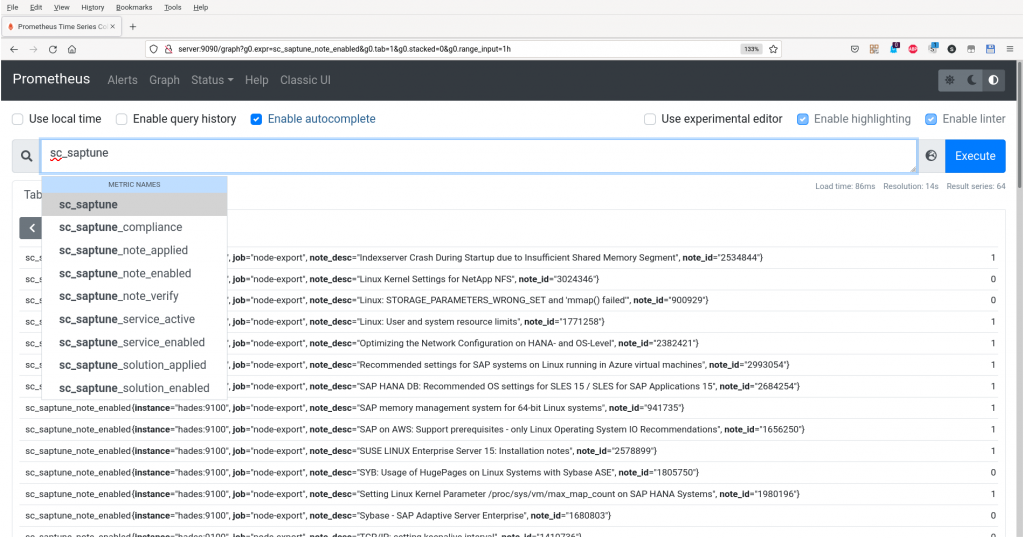
The Loot
If you go to your Prometheus server you should be able to to query the saptune data:
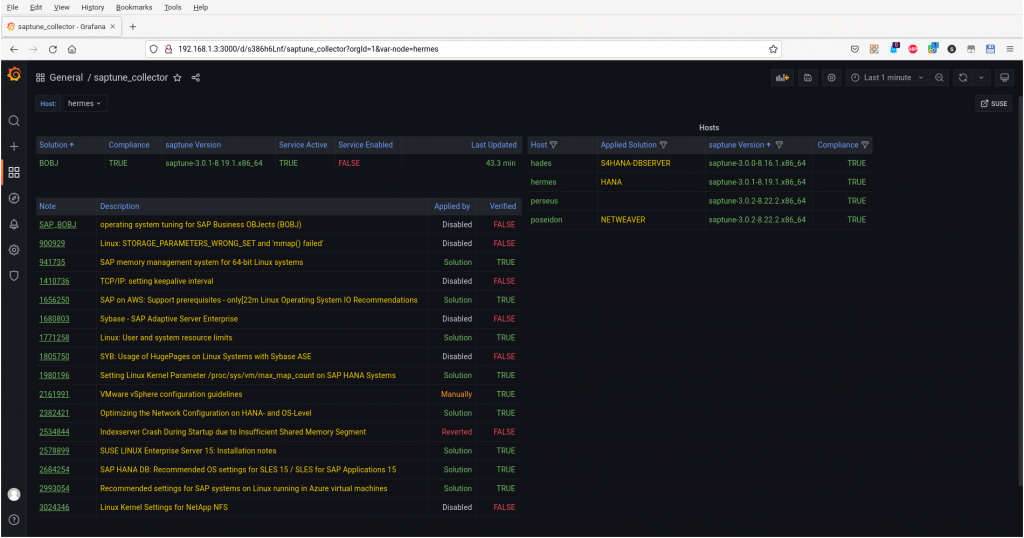
My colleague Thomas Schlosser created a little Grafana dashboard to represent the data. Take it as an inspiration, how this could look like. 😉
I hope you find this all useful. All what is left for me to say, is:
Have fun!
(Visited 76 times, 1 visits today)
Related Articles
Nov 11th, 2025
SUSE Private Registry: A safe Harbor for your containers.
4,019 views