Discover the hidden treasure
… or how to free even more data from the darkness
It’s been a while. Last time it was about unlocking new treasures through using new tools, or how to avoid being surprised by unexpected events:
https://www.suse.com/c/treasure-hunting-or-how-to-have-your-crazy-weekend-not-at-work/

The data treasure is growing
In the meantime, we all got rich and our treasures chest is well filled with data. We also installed the new updates and benefit from enhancements and security mechanisms. We have our Prometheus and Grafana landscape in a good shape. Actually, everything should be fine, but you can feel it, there is still something. Something is still hiding and it is important.
I was involved in an internal research project, which aimed to search for hardware-specific metrics interesting for SAP applications.
In the course of this project, we also took a close look at our internal test landscape and added one or two extensions. One example was the Prometheus discovery option for SUMA. On a side note, I’m sometimes surprised myself how easily I could have done things if I had known about it earlier. This may sound like marketing, but even for small infrastructures starting from 10 active server subscriptions SUMA offers a real added value without additional cost (you would get SUMA for free).
When we took a close look at our landscape we recognized that we miss the information from the disks that are connected to the RAID controller. All the important pieces of information like error counters or the status of the logical volumes are not accessible from the OS by default.
What exactly did we want to achieve?
We have a server with a RAID controller. The RAID controller provides the hard disks for our SLES15 SP3 as a logical device in two parts. The logical volumes of the RAID controller are on the one hand a RAID1 volume for the operating system and a RAID6 volume for the data on the other hand. So in SLES you see a /dev/sda and a /dev/sdb. What is completely lost however is the physical disk information. Perhaps due to the age of the hardware, it was not possible to read SMART data or query the status of the logical devices with tools provided by the OS. We had a blind spot in our monitoring. Our goal was to bring light into the darkness.
Now on to the technical part. Here I must first mention the support of a former colleague. Thanks to his help and the good cooperation we have as partners and colleagues, I was able to write this article.
Many thanks to you Peter Stark from FUJITSU.
What options do we have?
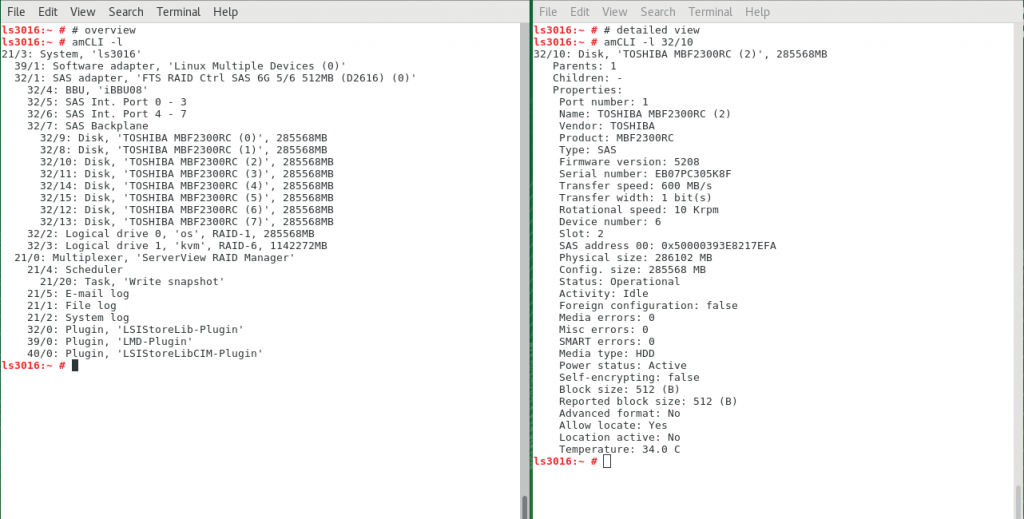
The tool “amCLI” can exactly display the information we are looking for: detailed data about the RAID controller and all associated devices, at runtime. Now we took the first hurdle.
# amCLI -l
...
 32/7: SAS Backplane
 32/11: Disk, 'TOSHIBA MBF2300RC (0)', 285568MB
 32/10: Disk, 'TOSHIBA MBF2300RC (1)', 285568MB
 32/9: Disk, 'TOSHIBA MBF2300RC (2)', 285568MB
 32/8: Disk, 'TOSHIBA MBF2300RC (3)', 285568MB
 32/15: Disk, 'TOSHIBA MBF2300RC (4)', 285568MB
 32/14: Disk, 'TOSHIBA MBF2300RC (5)', 285568MB
 32/13: Disk, 'TOSHIBA MBF2300RC (6)', 285568MB
 32/12: Disk, 'TOSHIBA MBF2300RC (7)', 285568MB
 32/2: Logical drive 0, 'LogicalDrive_0', RAID-1, 285568MB
 32/3: Logical drive 1, 'storage', RAID-6, 1142272MB
 ...

# amCLI -l 32/11
32/11: Disk, 'TOSHIBA MBF2300RC (0)', 285568MB
 Parents: 1
 Children: -
 Properties:
 Port number: 3
 Name: TOSHIBA MBF2300RC (0)
 Vendor: TOSHIBA
 Product: MBF2300RC
 Type: SAS
 Firmware version: 5208
 Serial number: EB07PC305JS2
 Transfer speed: 600 MB/s
 Transfer width: 1 bit(s)
 Rotational speed: 10 Krpm
 Device number: 7
 Slot: 0
 SAS address 00: 0x50000393E8216D5E
 Physical size: 286102 MB
 Config. size: 285568 MB
 Status: Operational
...
Unfortunately, there is no exporter that will also transfer this information to our Prometheus monitoring. Writing a custom exporter was not something we wanted to do. We needed to find a solution that also meets the enterprise principle of the OS.
Make full use of the Prometheus node_exporter!
During our search for a solution, we found the textfile.collector functionality of the Prometheus node_exporter. This option is already activated by default, so we just have to use it. We only have to define the path where the exporter should scan for text files.
Now we had to prepare the output of the “amCLI” and make it available in a file so that the node_exporter can collect it. Later we then can process the data in the Prometheus server.
These information sources helped:
- https://www.robustperception.io/using-the-textfile-collector-from-a-shell-script#more-4014
- https://github.com/OpenObservability/OpenMetrics/blob/main/specification/OpenMetrics.md#metric-types
The node_exporter has the textfile.collector option enabled by default. The only thing that we need to add is the path where the node_exporter has to look for *.prom files. The option is called –collector.textfile.directory=”<path>”.
# cat /etc/sysconfig/prometheus-node_exporter
## Path: Network/Monitors/Prometheus/node_exporter
## Description: Prometheus node exporter startup parameters
## Type: string
## Default: ''
ARGS="--collector.systemd --no-collector.mdadm --collector.ksmd --no-collector.rapl --collector.meminfo_numa --no-collector.zfs --no-collector.udp_queues --no-collector.softnet --no-collector.sockstat --no-collector.infiniband --collector.textfile.directory="/var/lib/node_exporter/""
Finally, the node_exporter needs to be informed about his configuration change.
# systemctl restart prometheus-node_exporter.service
The raw data of the RAID controller
The output of the “amCLI” provides a different level of detail of the data depending on the options set.
This output must be prepared to be used later in Prometheus. We had to think about and decide what information we wanted to use later and how it should be presented. For us, two things were useful: The first one was a label and the second one was values that change, like an error counter. So we picked values out of the “amCLI” output and defined them either as labels or as processable values. For queries where the labels were important to us, we decided to output a 0 or 1 as a value. For the second case, we return the value that the output provides.
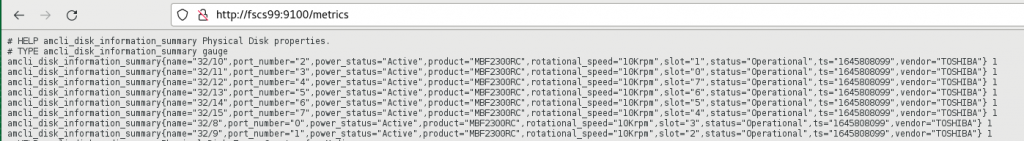
General information about the physical disks
Using “awk” we now prepared the output of the “amCLI” in such a way that we end up with a metric that has our name on it (amcli_disk_information_summary). We will call the script “amcli.sh”
#!/bin/bash

TEXTFILE_COLLECTOR_DIR=/var/lib/node_exporter
FILE=$TEXTFILE_COLLECTOR_DIR/amcli.prom
TS=$(date +%s)

{
 diskinfo=amcli_disk_information_summary
 echo "# HELP $diskinfo Physical Disk properties."
 echo "# TYPE $diskinfo gauge"

PHYDisks=$(amCLI --list |sed -ne '/Disk,/{s/^\s*//;s/:.*$//;p}')
 for disk in $PHYDisks; do
 output=$(amCLI -l $disk \
 | awk -v name=$disk -v ts=$TS 'BEGIN {
 slot = "";
 vendor = "";
 product = "";
 status = "";
 power_status = "";
 port_number = "";
 rotational_speed = "";
 }{
 if ($1 == "Vendor:") { vendor = $2; }
 if ($1 == "Product:") { product = $2; }
 if ($1 == "Port" && $2 == "number:") { port_number = $3; }
 if ($1 == "Rotational") { rotational_speed = $3 $4; }
 if ($1 == "Power" && $2 == "status:") { power_status = $3; }
 if ($1 == "Status:") { status = $2 $3 $4 $5; }
 if ($1 == "Slot:") { slot = $2; }
 } END {
 printf ("amcli_disk_information_summary{name=\"%s\", vendor=\"%s\", product=\"%s\", port_number=\"%s\", rotational_speed=\"%s\", power_status=\"%s\", slot=\"%s\", status=\"%s\", ts=\"%s\" }\n",
 name, vendor, product, port_number, rotational_speed, power_status, slot, status, ts);
 }')
 rc=$?
 if [ $rc = 0 ]; then
 stat=1
 else
 stat=0
 fi
 echo "$output $stat"
 done
} > "$FILE.$$"
mv $FILE.$$ $FILE

exit 0
# End
Once the script was executed the content of the file with the name “amcli.prom” looked like this:
# cat amcli.prom
# HELP amcli_disk_information_summary Physical Disk properties.
# TYPE amcli_disk_information_summary gauge
amcli_disk_information_summary{name="32/11", vendor="TOSHIBA", product="MBF2300RC", port_number="3", rotational_speed="10Krpm", power_status="Active", slot="0", status="Operational", ts="1646052400" } 1
amcli_disk_information_summary{name="32/10", vendor="TOSHIBA", product="MBF2300RC", port_number="2", rotational_speed="10Krpm", power_status="Active", slot="1", status="Operational", ts="1646052400" } 1
amcli_disk_information_summary{name="32/9", vendor="TOSHIBA", product="MBF2300RC", port_number="1", rotational_speed="10Krpm", power_status="Active", slot="2", status="Operational", ts="1646052400" } 1
amcli_disk_information_summary{name="32/8", vendor="TOSHIBA", product="MBF2300RC", port_number="0", rotational_speed="10Krpm", power_status="Active", slot="3", status="Operational", ts="1646052400" } 1
amcli_disk_information_summary{name="32/15", vendor="TOSHIBA", product="MBF2300RC", port_number="7", rotational_speed="10Krpm", power_status="Active", slot="4", status="Operational", ts="1646052400" } 1
amcli_disk_information_summary{name="32/14", vendor="TOSHIBA", product="MBF2300RC", port_number="6", rotational_speed="10Krpm", power_status="Active", slot="5", status="Operational", ts="1646052400" } 1
amcli_disk_information_summary{name="32/13", vendor="TOSHIBA", product="MBF2300RC", port_number="5", rotational_speed="10Krpm", power_status="Active", slot="6", status="Operational", ts="1646052400" } 1
amcli_disk_information_summary{name="32/12", vendor="TOSHIBA", product="MBF2300RC", port_number="4", rotational_speed="10Krpm", power_status="Active", slot="7", status="Operational", ts="1646052400" } 1
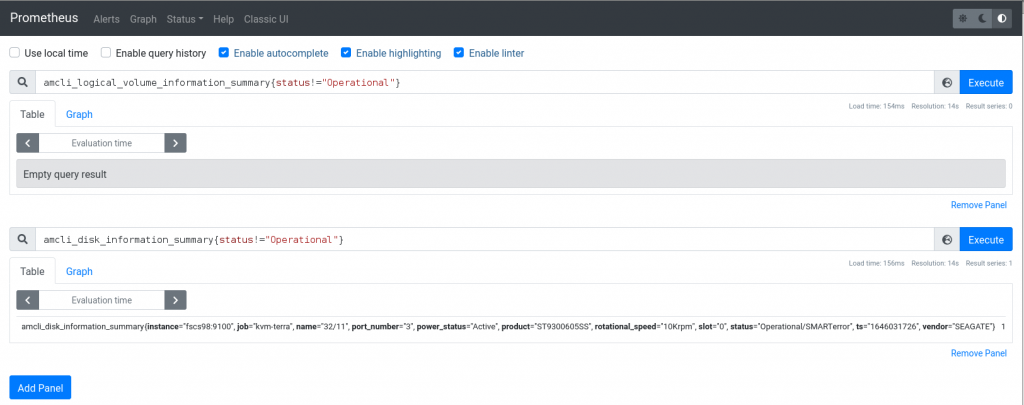
And here is the view from the node_exporter:
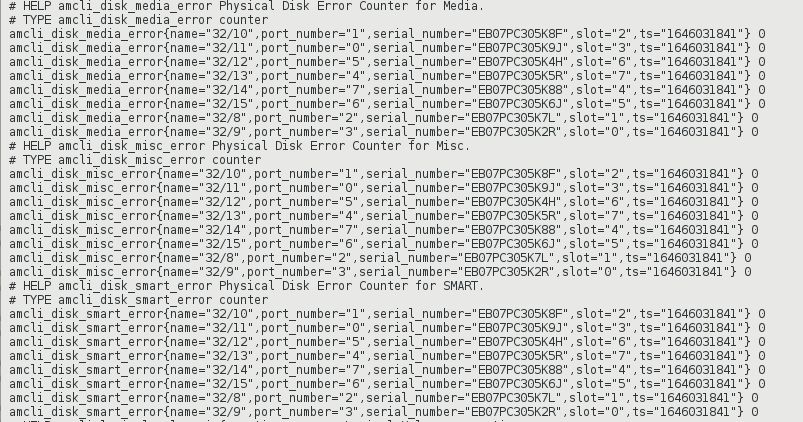
The error counters of each disk
We reused already existing labels from the general information section to be able to implement a mapping. Therefore we extended the script by this section:
 ...
 diskmedia=amcli_disk_media_error
 echo "# HELP $diskmedia Physical Disk Error Counter for Media."
 echo "# TYPE $diskmedia counter"

 diskmisc=amcli_disk_misc_error
 echo "# HELP $diskmisc Physical Disk Error Counter for Misc."
 echo "# TYPE $diskmisc counter"

 disksmart=amcli_disk_smart_error
 echo "# HELP $disksmart Physical Disk Error Counter for SMART."
 echo "# TYPE $disksmart counter"

 for disk in $(amCLI --list |sed -ne '/Disk,/{s/^\s*//;s/:.*$//;p}'); do
 DISKmedia=$(amCLI -l $disk \
 | awk -v name=$disk -v ts=$TS 'BEGIN {
 slot = "";
 port_number = "";
 serial_number = "";
 }{
 if ($1 == "Port") { port_number = $3; }
 if ($1 == "Status:") { status = $2 $3 $4; }
 if ($1 == "Slot:") { slot = $2; }
 if ($1 == "Media" && $2 == "errors:") { media_error = $3; }
 if ($1 == "Misc" && $2 == "errors:") { misc_error = $3; }
 if ($1 == "SMART" && $2 == "errors:") { smart_error = $3; }
 if ($1 == "Serial" && $2 == "number:") { serial_number = $3; }
 } END {
 printf ("amcli_disk_media_error{name=\"%s\", port_number=\"%s\", serial_number=\"%s\", slot=\"%s\", ts=\"%s\" } %s\n",
 name, port_number, serial_number, slot, ts, media_error);
 printf ("amcli_disk_misc_error{name=\"%s\", port_number=\"%s\", serial_number=\"%s\", slot=\"%s\", ts=\"%s\" } %s\n",
 name, port_number, serial_number, slot, ts, misc_error);
 printf ("amcli_disk_smart_error{name=\"%s\", port_number=\"%s\", serial_number=\"%s\", slot=\"%s\", ts=\"%s\" } %s\n",
 name, port_number, serial_number, slot, ts, smart_error);
 }')
 echo "$DISKmedia"
 done
...
After the script was executed again the contents of the file looked now like this:
# cat amcli.prom
# HELP amcli_disk_information_summary Physical Disk properties.
# TYPE amcli_disk_information_summary gauge
amcli_disk_information_summary{name="32/11", vendor="TOSHIBA", product="MBF2300RC", port_number="3", rotational_speed="10Krpm", power_status="Active", slot="0", status="Operational", ts="1646054157" } 1
amcli_disk_information_summary{name="32/10", vendor="TOSHIBA", product="MBF2300RC", port_number="2", rotational_speed="10Krpm", power_status="Active", slot="1", status="Operational", ts="1646054157" } 1
amcli_disk_information_summary{name="32/9", vendor="TOSHIBA", product="MBF2300RC", port_number="1", rotational_speed="10Krpm", power_status="Active", slot="2", status="Operational", ts="1646054157" } 1
amcli_disk_information_summary{name="32/8", vendor="TOSHIBA", product="MBF2300RC", port_number="0", rotational_speed="10Krpm", power_status="Active", slot="3", status="Operational", ts="1646054157" } 1
amcli_disk_information_summary{name="32/15", vendor="TOSHIBA", product="MBF2300RC", port_number="7", rotational_speed="10Krpm", power_status="Active", slot="4", status="Operational", ts="1646054157" } 1
amcli_disk_information_summary{name="32/14", vendor="TOSHIBA", product="MBF2300RC", port_number="6", rotational_speed="10Krpm", power_status="Active", slot="5", status="Operational", ts="1646054157" } 1
amcli_disk_information_summary{name="32/13", vendor="TOSHIBA", product="MBF2300RC", port_number="5", rotational_speed="10Krpm", power_status="Active", slot="6", status="Operational", ts="1646054157" } 1
amcli_disk_information_summary{name="32/12", vendor="TOSHIBA", product="MBF2300RC", port_number="4", rotational_speed="10Krpm", power_status="Active", slot="7", status="Operational", ts="1646054157" } 1
# HELP amcli_disk_media_error Physical Disk Error Counter for Media.
# TYPE amcli_disk_media_error counter
# HELP amcli_disk_misc_error Physical Disk Error Counter for Misc.
# TYPE amcli_disk_misc_error counter
# HELP amcli_disk_smart_error Physical Disk Error Counter for SMART.
# TYPE amcli_disk_smart_error counter
amcli_disk_media_error{name="32/11", port_number="3", serial_number="EB07PC305JS2", slot="0", ts="1646054157" } 0
amcli_disk_misc_error{name="32/11", port_number="3", serial_number="EB07PC305JS2", slot="0", ts="1646054157" } 0
amcli_disk_smart_error{name="32/11", port_number="3", serial_number="EB07PC305JS2", slot="0", ts="1646054157" } 0
amcli_disk_media_error{name="32/10", port_number="2", serial_number="EB07PC305JUV", slot="1", ts="1646054157" } 0
amcli_disk_misc_error{name="32/10", port_number="2", serial_number="EB07PC305JUV", slot="1", ts="1646054157" } 0
amcli_disk_smart_error{name="32/10", port_number="2", serial_number="EB07PC305JUV", slot="1", ts="1646054157" } 0
amcli_disk_media_error{name="32/9", port_number="1", serial_number="EB07PC305K2W", slot="2", ts="1646054157" } 0
amcli_disk_misc_error{name="32/9", port_number="1", serial_number="EB07PC305K2W", slot="2", ts="1646054157" } 0
amcli_disk_smart_error{name="32/9", port_number="1", serial_number="EB07PC305K2W", slot="2", ts="1646054157" } 0
amcli_disk_media_error{name="32/8", port_number="0", serial_number="EB07PC305K5J", slot="3", ts="1646054157" } 0
amcli_disk_misc_error{name="32/8", port_number="0", serial_number="EB07PC305K5J", slot="3", ts="1646054157" } 0
amcli_disk_smart_error{name="32/8", port_number="0", serial_number="EB07PC305K5J", slot="3", ts="1646054157" } 0
amcli_disk_media_error{name="32/15", port_number="7", serial_number="EB07PC305K96", slot="4", ts="1646054157" } 0
amcli_disk_misc_error{name="32/15", port_number="7", serial_number="EB07PC305K96", slot="4", ts="1646054157" } 0
amcli_disk_smart_error{name="32/15", port_number="7", serial_number="EB07PC305K96", slot="4", ts="1646054157" } 0
amcli_disk_media_error{name="32/14", port_number="6", serial_number="EB07PC305JNS", slot="5", ts="1646054157" } 0
amcli_disk_misc_error{name="32/14", port_number="6", serial_number="EB07PC305JNS", slot="5", ts="1646054157" } 0
amcli_disk_smart_error{name="32/14", port_number="6", serial_number="EB07PC305JNS", slot="5", ts="1646054157" } 0
amcli_disk_media_error{name="32/13", port_number="5", serial_number="EB07PC305JSC", slot="6", ts="1646054157" } 0
amcli_disk_misc_error{name="32/13", port_number="5", serial_number="EB07PC305JSC", slot="6", ts="1646054157" } 0
amcli_disk_smart_error{name="32/13", port_number="5", serial_number="EB07PC305JSC", slot="6", ts="1646054157" } 0
amcli_disk_media_error{name="32/12", port_number="4", serial_number="EB07PC305JR7", slot="7", ts="1646054157" } 0
amcli_disk_misc_error{name="32/12", port_number="4", serial_number="EB07PC305JR7", slot="7", ts="1646054157" } 0
amcli_disk_smart_error{name="32/12", port_number="4", serial_number="EB07PC305JR7", slot="7", ts="1646054157" } 0
The view in the browser looks as expected:
Gathering everything that seems important
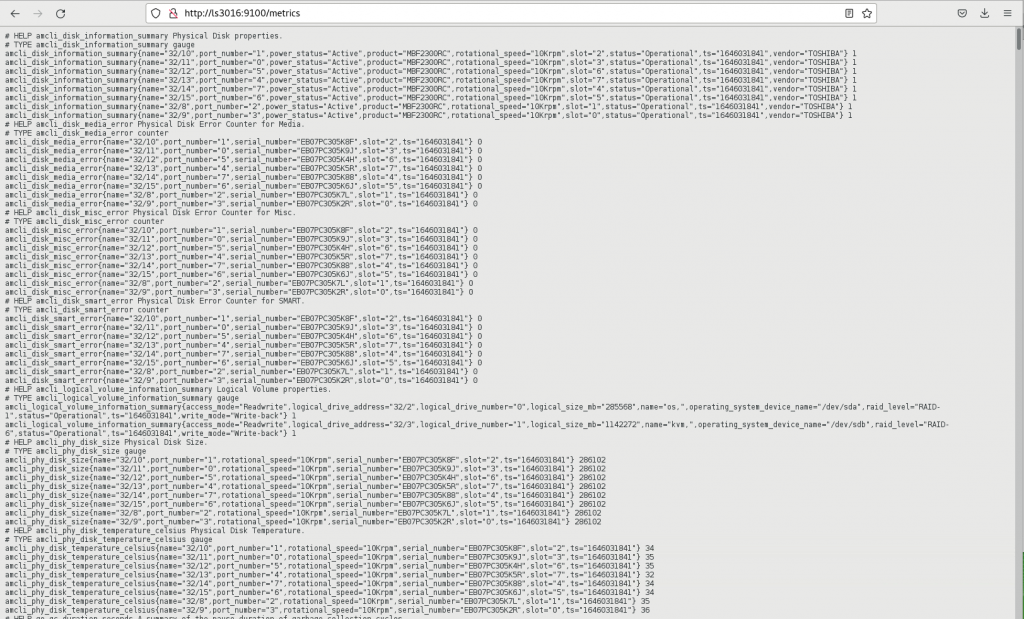
Using this method extending the script, we were able to gather all the information that we had no access to before.
Well done! And now there is light.
Regular update of the status information
For this task, we used “systemd.service” and “systemd.timer”. Alternatively, this could also be realized by means of “cron”. Our script needs executable permissions for this.
# chmod 750 amcli.sh
Under “/etc/systemd/system/” we now create the timer and the service unit. We start with a timer calling the service every minute. With the 15sec scrap interval, we know that the information in Prometheus is only updated every 4th interval.
# cat /etc/systemd/system/prometheus_amcli.timer
 [Unit]
 Description=Collecting RAID controller information
 Documentation=man:amCLI

[Timer]
 OnCalendar=*-*-* *:*:00
 Persistent=true
 Unit=prometheus_amcli.service

[Install]
 WantedBy=multi-user.target
# cat /etc/systemd/system/prometheus_amcli.service
[Unit]
Description=Collecting RAID controller information
Documentation=man:amCLI

[Service]
Type=simple
Restart=no
ExecStart=/usr/local/bin/amcli.sh
Nice=19

[Install]
WantedBy=multi-user.target
Now “systemd” needs to be informed about the new units:
# systemctl daemon-reload
Enable and start the monitoring extension for the node_exporter:
# systemctl enable prometheus_amcli.timer

Created symlink /etc/systemd/system/multi-user.target.wants/prometheus_amcli.timer → /etc/systemd/system/prometheus_amcli.timer.

# systemctl enable --now prometheus_amcli.timer
Check the status again briefly:
# systemctl status prometheus_amcli
● prometheus_amcli.service - Collecting RAID controller information
 Loaded: loaded (/etc/systemd/system/prometheus_amcli.service; disabled; vendor preset: disabled)
 Active: inactive (dead) since Mon 2022-02-28 07:52:07 CET; 2s ago
 Docs: man:amCLI
 Process: 4824 ExecStart=/usr/local/bin/amcli.sh (code=exited, status=0/SUCCESS)
 Main PID: 4824 (code=exited, status=0/SUCCESS)

Feb 28 07:52:03 fscs99 systemd[1]: Started Collecting RAID controller information.
# systemctl status prometheus_amcli.timer
● prometheus_amcli.timer - Collecting RAID controller information
 Loaded: loaded (/etc/systemd/system/prometheus_amcli.timer; enabled; vendor preset: disabled)
 Active: active (waiting) since Mon 2022-02-28 07:30:24 CET; 21min ago
 Trigger: Mon 2022-02-28 07:53:00 CET; 44s left
 Docs: man:amCLI

Feb 28 07:30:24 fscs99 systemd[1]: Stopping Collecting RAID controller information.
Feb 28 07:30:24 fscs99 systemd[1]: Started Collecting RAID controller information.
The data is now retrieved every minute with our script and the output is redirected to a file that the Prometheus node_exporter can process.
The result of our work now looks like this:
Activating the notification
As the last step, we set up alerts using Prometheus alertmanager. To do this, we first built our metrics using the Prometheus Web UI. Once we had the desired result, we could easily include these metrics in our Prometheus rule file, as shown in the picture below.
Summary
We’ve done it. Using the Prometheus node_exporter and the textfile.collector option, we have provided ourselves with data that we did not have access to before. No other exporter was needed. However, it was necessary to prepare the information of the “amCLI” tool and to set up a regular data reconciliation.
The solution meets our requirements and fulfills its purpose.
Many thanks to my colleague Thomas and to Peter who helped me with the implementation.
This task was driven by “The Power of Many” and I’m glad to be part of it.
See you soon
Bernd
Update March 17 2022
- changing script and output file path
Remark: A more generic tool for collecting the information from the RAID controller would be MegaCli64.
Related Articles
Jan 23rd, 2026
KIWI basics for openSUSE Tumbleweed Minimal OS images
Oct 17th, 2025
The new SUSE Support Experience is Live
Apr 22nd, 2026