Treasure hunting or how to have your crazy weekend NOT at work…
Cloud service provider (CSP) deployment wizards and ready2go deployment solutions are state of the art today. The installation of a complete SAP landscape, e.g. with the SUSE Terraform project (please check here), can be done within hours. What you will get is something like in the example picture below. With each new system your hidden data treasure is growing.

What do I need to get access to my hidden treasure?
New deployment method’s and rapidly growing infrastructures do not longer fit into traditional monitoring solutions. As a result the kubernetes community has developed a solution for that. With SUSE Linux Enterprise for SAP Applications we adopted these technologies. Therefore we deliver and support these four Prometheus exporter’s:
As a result the combination of products like Grafana, Prometheus, Loki or a CSP monitoring solution help you uncover your data treasure.
How do I make the data available?
Let’s take the example shown in the picture above and give you some hint’s how to install and configure some of the exporters. Firstly a short overview where we starting from. Secondly what we can expect at the end.
What we have:
- SAP HANA SR enabled between node hana01 and hana02
- Pacemaker enabled for HANA SR setup
- HANA SID -> NAT
- HANA InstNr -> 04
- vIP for primary HANA, controlled by Pacemaker
- SAP ASCS / ERS instances are running on node netweaver01 and netweaver02
- Pacemaker enabled for SAP ENSA2 setup
- shared storage for SAP workload on node drbd01 and drbd02
- Pacemaker enabled DRBD setup –> provide NFS
- Grafana, Prometheus and Loki running on node monitor
- SUSE Linux Enterprise for SAP applications 15 SP2
What we want:
- Collect system and application data from both HANA nodes and store them in a central place
- Visualize the data for multiple clusters in one Grafana dashboard
- Combine data from exporters and log aggregation
- Use the data for trending
Step by step:
The Prometheus exporters prometheus-node_exporter and prometheus-cluster_exporter are very easy to implement. Therefore we install both exporters on both nodes (hana01 and hana02).
Installing node_exporter
Firstly install the prometheus-node_exporter on both nodes (hana01 and hana02).
zypper -n in golang-github-prometheus-node_exporter
systemctl enable --now prometheus-node_exporter
systemctl status prometheus-node_exporter
Similarly another option to verify the exporter is running (the default port 9100):
ss -tulpan |grep expor
Installing cluster exporter
Secondly install the prometheus-ha_cluster_exporter on both nodes (hana01 and hana02).
zypper -n in prometheus-ha_cluster_exporter
systemctl enable --now prometheus-ha_cluster_exporter
systemctl status prometheus-ha_cluster_exporter
Alternatively use ss to verify the exporter is running (the default port 9664):
ss -tulpan |grep expor
Installing hanadb-exporter
The prometheus-hanadb_exporter needs a bit more configuration after the installation on both nodes. The hanadb_exporter should be implemented as a cluster resource. Pacemaker will be responsible that the exporter is up running all the time. This approach has the advantage that only one exporter is running, presenting the data. In addition the same IP adress can be used by the Prometheus server to reach the hanadb_exporter, regardlees of where the exporter is running.
Additional background information can be found on our Github page.
Now lets install the hanadb_exporter. Therefore we execute the following steps on both nodes.
zypper -n in prometheus-hanadb_exporter
Installing additional SAP software installation from SAP HANA Client folder
ls /hana/shared/???/hdbclient/hdbcli-*.tar.gz
cd /hana/shared/???/hdbclient/
pip install hdbcli-2.5.109.tar.gz
Preparing a HANA DB specific systemd service configuration file
Copy the example file into a customized file. I took the SID of the HANA DB and instance as an identifier (NAT — HDB04).
cp /usr/etc/hanadb_exporter/config.json.example /usr/etc/hanadb_exporter/NAT_HDB04.json
The following values need to be adapted:
- host (IP or hostname) –> of the localhost
- port (instance number) –> of HANA
- password (monitoring user or system) –> using the HANA DB secure store is also possible look at the Github project.
- config_file (add the full path default is /usr/etc/hanadb-exporter or move the file and use the new path)
- log_file (add the full path) –> e.g. /var/log/…
vi /usr/etc/hanadb_exporter/NAT_HDB04.json
Testing the start of the systemd unit on both nodes (the default port 9668)
To start the systemd unit and check if the exporter is starting execute the following commands:
systemctl start prometheus-hanadb_exporter@NAT_HDB04
systemctl status prometheus-hanadb_exporter@NAT_HDB04
ss -tulpan |grep expor
systemctl stop prometheus-hanadb_exporter@NAT_HDB04
Don’t enable and start the unit with “… enable –now …” because it will be controlled by pacemaker.
Implementing the prometheus-hanadb_exporter in the existing HANA SR cluster configuration
Now we implement the systemd unit for the hanadb_exporter as a cluster resource.
crm configure edit
As an example I’ve added the primitive and colocation rule for a HANA DB as shown below:
primitive rsc_exporter_NAT_HDB04 systemd:prometheus-hanadb_exporter@NAT_HDB04 \
 op start interval=0 timeout=100 \
 op stop interval=0 timeout=100 \
 op monitor interval=10 \
 meta resource-stickiness=0 \
 meta target-role=Started
 colocation col_exporter_NAT_HDB04 -inf: rsc_exporter_NAT_HDB04:Started msl_SAPHana_NAT_HDB04:Slave
Adding the new exporters to the Prometheus server
After the installation of all needed exporters we now can add them on the Prometheus server (the treasure host).
vi /etc/prometheus/prometheus.yml
Restart the Prometheus server and start collecting the data.
systemctl restart prometheus
How to add these new exporters depends a bit on your structure inside your prometheus.yml file. In this case we have sorted and grouped the server based on their functions.
[…]
- job_name: hana
  scrape_interval: 30s
  scrape_timeout: 30s
  static_configs:
    - targets:
      - "192.168.144.11:9100" # node_exporter
      - "192.168.144.12:9668" # hanadb_exporter
      - "192.168.144.11:9664" # ha_cluster_exporter
      - "192.168.144.10:9100" # node_exporter
      - "192.168.144.10:9664" # ha_cluster_exporter
[…]
As a result we have added more sources to collect data from. Finally your data treasure is growing.
Setting up promtail and forwarding log’s to Loki
Together with the package loki the promtail client will be installed. Besides that, Loki server is already running and configured on my server called monitor (or the treasure host). In the first place I want forward the log files from both HANA nodes to the monitor host.
Installation of loki from the SUSE-PackageHub
First we install loki using zypper. If the repository PackageHub is not available add the repository as described here.
*Usage of software from SUSE Package Hub is not covered by SUSE support agreements
zypper -n in loki
Next promtail.yaml needs to be adapted on both nodes in the same way. This would simplify the administration later if required.
vi /etc/loki/promtail.yaml
Change the following:
- filename (/tmp/promtail-positions.yaml)
- url: add the Loki server address here
- job name: add your config here
The result should look somewhat like this:
server:
 http_listen_port: 9080
 grpc_listen_port: 0

positions:
 filename: /tmp/positions.yaml

clients:
 - url: http://monitor:3100/loki/api/v1/push

scrape_configs:
- job_name: journal
 journal:
   labels:
     job: systemd-journal
 relabel_configs:
 - source_labels:
   - __journal__systemd_unit
   target_label: systemd_unit
 - source_labels:
   - __journal__hostname
   target_label: hostname
 - source_labels:
   - __journal_syslog_identifier
   target_label: syslog_identifier
The loki user needs permission to get access to the systemd-journal log.
usermod -G systemd-journal -a loki
Next we can start and check if promtail is running (default port is 9080).
systemctl enable --now promtail
systemctl status promtail
ss -tulpan |grep prom
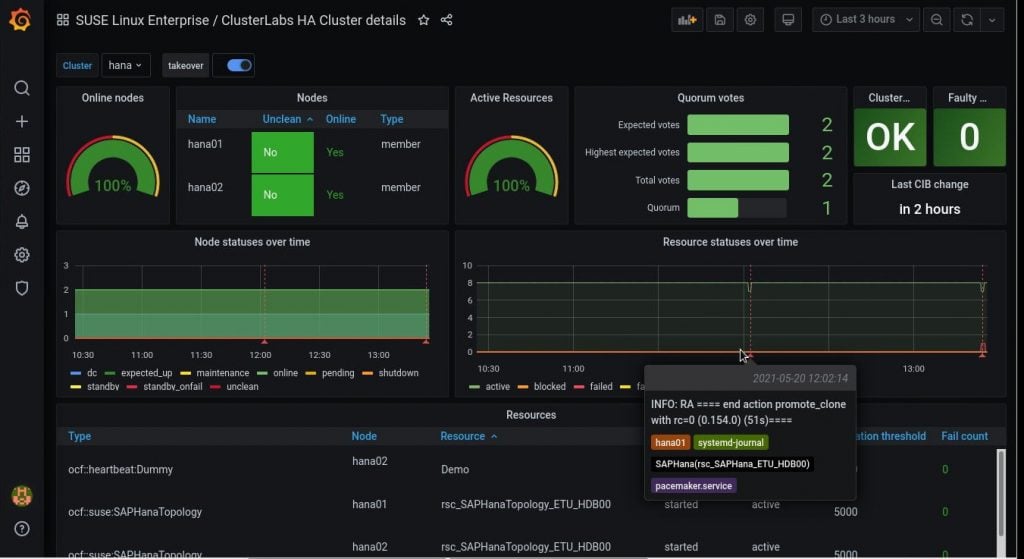
Combining the data from Prometheus and Loki into a Grafana dashboard
Now its time to use the tools and uncover the treasure. As an example I’d like to mark a successful executed HANA DB cluster takeover in the single Cluster dashboard (Grafana ID ⇒12229). By the way SUSE’s contribution to the Grafana dashboard collection can be checked here. In addition to the single Cluster dashboard shown here I would like to recommend the HA Multi-Cluster overview dashboard.
How to add a new dashboard in Grafana
Open your browser and connect to your Grafana instance (default port 3000). Usually you must login before you can modify anything. Afterwards click on the left side on the Dashboards icon and select Manage. In the upper right corner there is a IMPORT button. There you could enter a Grafana dashboard ID or import a json file. Lastly you can change the name of the dashboard, choose a place where to store it. Next select Prometheus as data source and click on IMPORT.
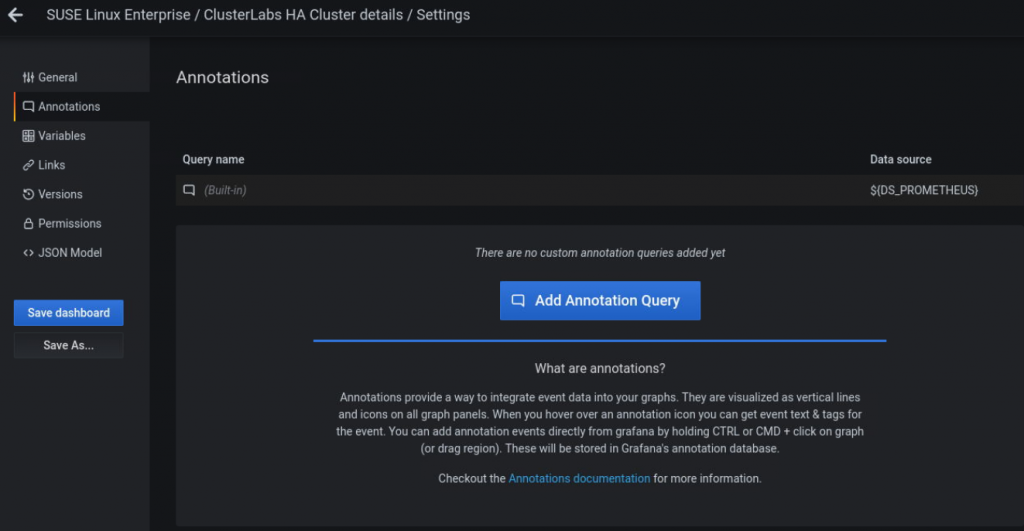
Enabling Grafana dashboard annotation for specific events
Firstly after you logged in and opened the Cluster dashboard, you can change the settings of the dashboard by clicking on Dashboard setting in the upper right corner. Secondly to the left you will find Annotations. Select this and click on Add Annotation Query in the middle of your window.
Here is an example using Loki as a data source and the query for log entries indicating a successful HANA DB takeover in the cluster.
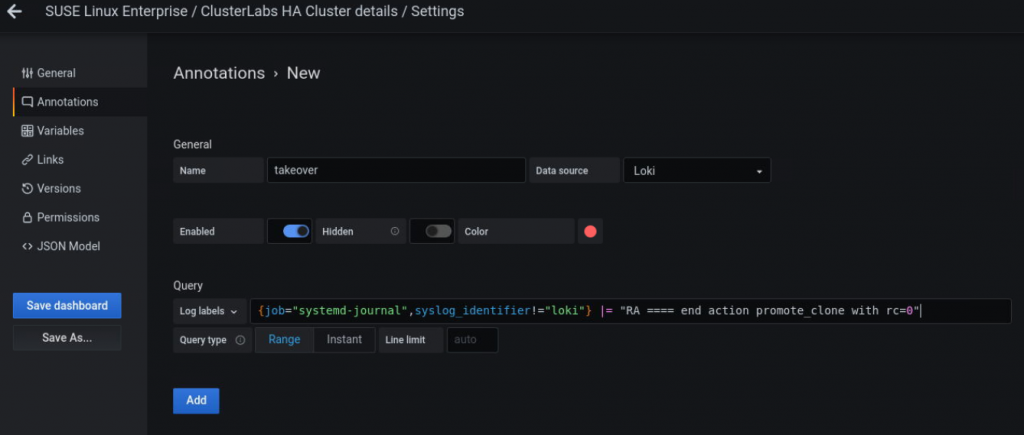
In addition I would like to mention the Grafana Explore option as beening very useful for finding the right query. Here is the query example from the picture above:
{job="systemd-journal",syslog_identifier!="loki"} |= "RA ==== end action promote_clone with rc=0"
Afterwards click on Add and go back to your dashboard. Finally you will find a small switch like this:
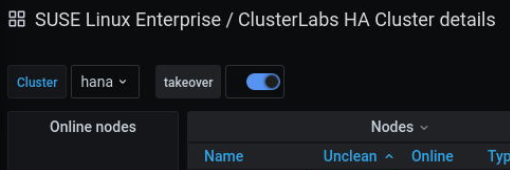
There we are. The treasure is yours!
Compared to the traditional monitoring we now have a database containing historical data of our system, which we can use to observe. By the way, we can use this data for trending and estimating critical events like “disk full”.
In summary it is not difficult collecting the data (Prometheus exporter, promtail) and making them available (Prometheus server, Loki server) in an easily consumable, central place (Grafana).
Finally its on you to take advantage of this treasure and using them wisely. Consequently it could mitigate unexpected infrastructure downtime and save your family time.
See you soon, the SUSE team.
Related Articles
Oct 21st, 2024
Edge Computing Made Easy with SUSE and Simply NUC
May 22nd, 2025