A Modern Approach to SAP Infrastructure Observability with Grafana Alloy
Managing a high-availability SAP environment requires balancing strict uptime demands with infrastructure complexity. For critical applications like SAP S/4HANA, clear visibility into hardware and operating system metrics is necessary to detect and resolve issues early.
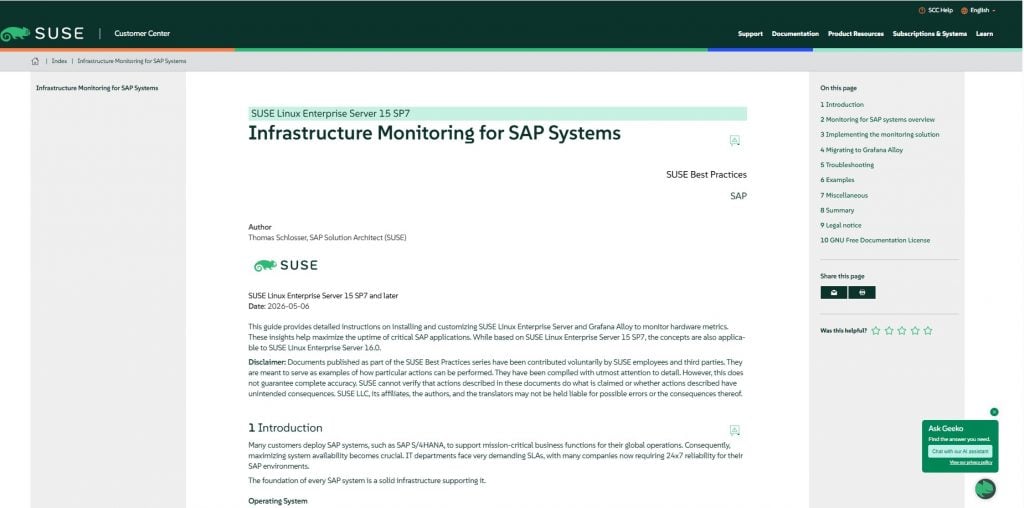
Historically, tracking these components meant running multiple standalone data collectors across your network. In the latest SUSE Best Practices guide, authored by our brilliant SAP Solution Architect Thomas Schlosser, we outline an updated framework using Grafana Alloy for SUSE Linux Enterprise Server 15 SP7 and version 16.0. This approach replaces fragmented tools with a single, modular telemetry agent.
Moving from Network Scans to Secure Outbound Streams
Traditional monitoring relies on a “pull” model, where a central server reaches out across the network to scrape data. This requires keeping incoming network ports open on your production servers.
Grafana Alloy shifts this mechanism to a local host layer. Available natively in the SUSE repository (zypper in alloy), it processes metrics and logs locally and uses an outbound push model. By pushing unified telemetry directly to your central backend—whether that is Prometheus, Loki, or SUSE Observability—your systems remain closed to incoming scraping attempts.
How the Local Data Pipeline Works
The agent organizes system data into four explicit operational stages:
- Data Source — The origin point of the information, split between internal data (including CPU, memory, and network metrics, as well as log files and systemd journals ) and external metrics from hardware (via SNMP or Redfish).
- Data Collection — Built-in exporter functions handle standard operating system and process metrics, while the agent can also act as a local aggregator for specialized hardware tools like the Intel Processor Counter Monitor (PCM).
- Data Processing — Raw data can be filtered or relabeled before leaving the host to strip out unnecessary lines, inject environment labels, or swap technical addresses for human-readable hostnames.
- Data Push — The finalized data stream is securely transmitted to your backend. Because the pipeline is modular, destinations can be changed without disrupting your collection rules.
Transitioning from Promtail to Alloy
For teams currently utilizing Promtail for log management, a migration plan is necessary. Promtail officially reached its End of Life (EOL) on March 2, 2026, and Grafana Alloy has assumed its role as the primary logging agent. The good news— the transition does not require rebuilding configurations manually. Alloy includes a native conversion utility that automatically translates your legacy Promtail rules into the native pipeline format.
Diagnostic Tools and Validation
To help administrators confirm that pipelines are functioning correctly, Alloy includes a built-in Web UI accessible on port 12345. This interface displays a real-time health map of every active block in the data flow. Supported scraper and writer components also allow for live debugging to view data streams in real time.
The Bottom Line
When you are managing enterprise infrastructure supporting mission-critical business functions, complexity is your enemy. But maintaining the availability of SAP S/4HANA is critical for ensuring uninterrupted business operations. By switching to Grafana Alloy, you gain a more efficient, scalable, and flexible foundation for enterprise-grade observability through a single agent that handles metrics, logs, and traces while simplifying troubleshooting.
If you’re ready to step into an easier, more flexible enterprise observability workflow, grab the full step-by-step implementation guide and configuration examples are available in the comprehensive SUSE Best Practices paper at documentation.suse.com.
Stay curious, keep your systems optimized, and I’ll see you when discussing the next SUSE Best Practices!
Related Articles
May 22nd, 2025
Top 8 Reasons to Get SUSE Certified