Introduction to Kubernetes Monitoring
Introduction
With over 40,000 stars on Github, more than 70,000 commits, and with major contributors like Google and Redhat, Kubernetes has rapidly taken over the container ecosystem to become the true leader of container orchestration platforms. Despite Kubernetes’s popularity, monitoring Kubernetes presents many challenges. To understand these challenges and their solutions, it’s best to start with a review of how Kubernetes works.
Understanding Kubernetes and Its Abstractions
At the infrastructure level, a Kubernetes cluster is a set of physical or virtual machines acting in a specific role. The machines acting in the role of Master act as the brain of all operations and are charged with orchestrating containers that run on all of the Nodes.
-
Master components manage the lifecycle of a pod, the base unit of deployment within a Kubernetes cluster. If a pod dies, the Controller creates a new one. If you scale the number of pod replicas up or down, the Controller creates or destroys pods to satisfy your request. The Master role includes the following components:
kube-apiserver– exposes APIs for the other master components.etcd– a consistent and highly-available key/value store used for storing all internal cluster data.kube-scheduler– uses information in the Pod spec to decide on which Node to run a Pod.kube-controller-manager– responsible for Node management (detecting if a Node fails), pod replication, and endpoint creation.cloud-controller-manager– runs controllers that interact with the underlying cloud providers.
-
Node components are worker machines in Kubernetes and are managed by the Master. A node may be a virtual machine (VM) or physical machine, and Kubernetes runs equally well on both types of systems. Each node contains the necessary components to run pods:
kubelet: handles all communication between the Master and the node on which it is running. It interfaces with the container runtime to deploy and monitor containers.kube-proxy: maintains the network rules on the host and handles transmission of packets between pods, the host, and the outside world.- container runtime: responsible for running containers on the host. The most popular engine is Docker, although Kubernetes supports container runtimes from rkt, runc and others.
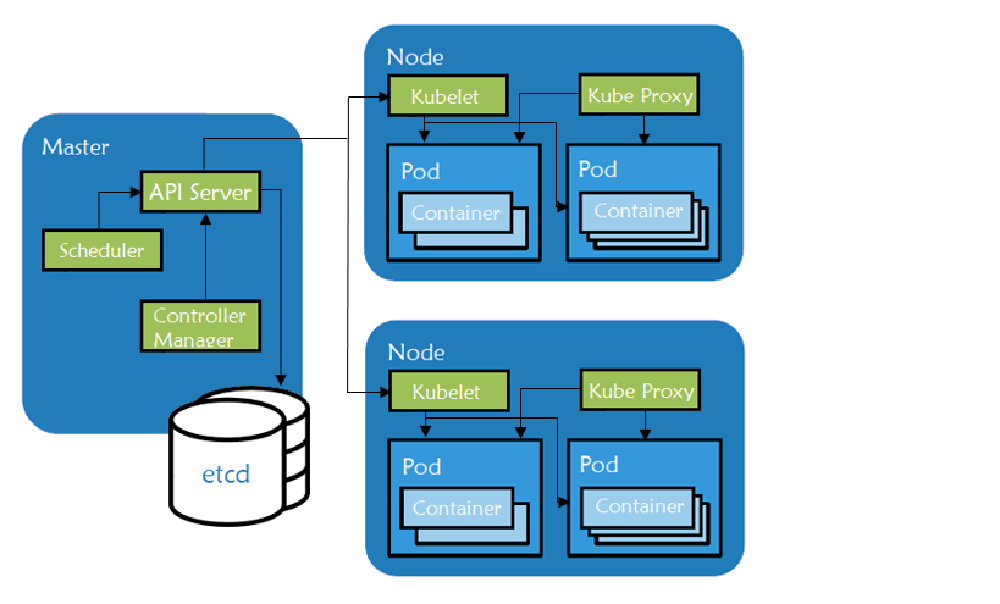
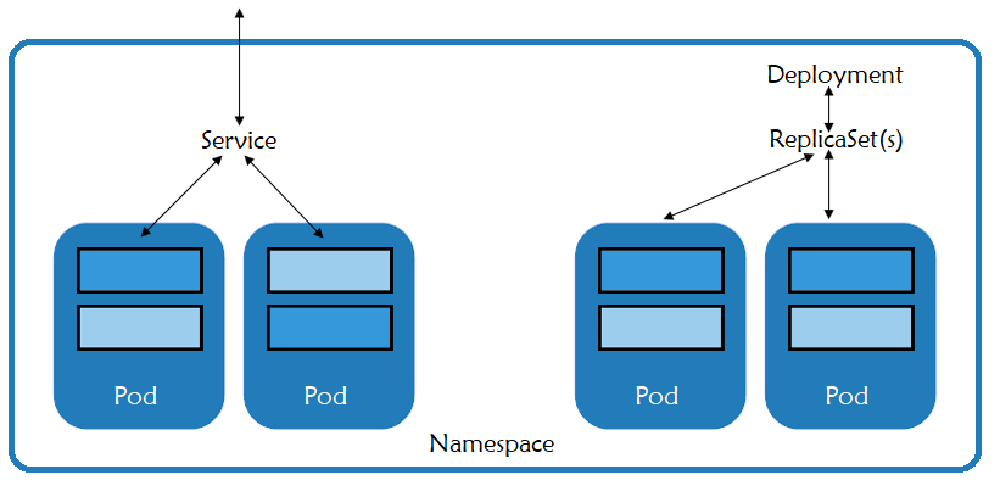
From a logical perspective, a Kubernetes deployment is comprised of various components, each serving a specific purpose within the cluster.
- Pods are the basic unit of deployment within Kubernetes. A pod consists of one or more containers that share the same network namespace and IP address. Best practices recommend that you create one pod per application component so you can scale and control them separately.
- Services provide a consistent IP address in front of a set of pods and a policy that controls access to them. The set of pods targeted by a service is often determined by a label selector. This makes it easy to point the service to a different set of pods during upgrades or blue/green deployments.
- ReplicaSets are controlled by deployments and ensure that the desired number of pods for that deployment are running.
- Namespaces define a logical namespace for resources such as pods and services. They enable resources to use the same names, whereas resources in a single namespace must have unique names. Rancher uses namespaces with its role-based access control to provide a secure separation between namespaces and the resources running inside of them.
- Metadata marks containers based on their deployment characteristics.
Monitoring Kubernetes
Multiple services and namespaces can be spread across the infrastructure. As seen above, each of the services are made of pods, which can have one or more containers inside. With so many moving parts, monitoring even a small Kubernetes cluster can present a challenge. Monitoring Kubernetes requires a deep understanding of the application architecture and functionality in order to design and manage an effective solution.
Kubernetes ships with tools for monitoring the cluster:
- Probes actively monitor the health of a container. If the probe determines that a container is no longer healthy, the probe will restart it.
- cAdvisor is an open source agent that monitors resource usage and analyzes the performance of containers. Originally created by Google, cAdvisor is now integrated with the Kubelet. It collects, aggregates, processes and exports metrics such as CPU, memory, file and network usage for all containers running on a given node.
- The kubernetes dashboard is an add-on which gives an overview of the resources running on your cluster. It also gives a very basic means of deploying and interacting with those resources.
Kubernetes has tremendous capability for automatically recovering from failures. It can restart pods if a process crashes, and it will redistribute pods if a node fails. However, for all of its power, there are times when it cannot fix a problem. In order to detect those situations, we need additional monitoring.
Layers Of Monitoring
Infrastructure
All clusters should have monitoring of the underlying server components because problems at the server level will show up in the workloads.
What to monitor?
- CPU utilization. Monitoring the CPU will reveal both system and user consumption, and it will also show iowait. When running clusters in the cloud or with any network storage, iowait will indicate bottlenecks waiting for storage reads and writes (i/o processes). An oversubscribed storage framework can impact performance.
- Memory usage. Monitoring memory will show how much memory is in use and how much is available, either as free memory or as cache. Systems that run up against memory limits will begin to swap (if swap is available on the system), and swapping will rapidly degrade performance.
- Disk pressure. If a system is running write-intensive services like etcd or any datastore, running out of disk space can be catastrophic. The inability to write data will result in corruption, and that corruption can transfer to real-world losses. Technologies like LVM make it trivial to grow disk space as needed, but keeping an eye on it is imperative.
- Network bandwidth. In today’s era of gigabit interfaces, it might seem like you can never run out of bandwidth. However, it doesn’t take more than a few aberrant services, a data breach, system compromise, or DOS attack to eat up all of the bandwidth and cause an outage. Keeping awareness of your normal data consumption and the patterns of your application will help you keep costs down and also aid in capacity planning.
- Pod resources. The Kubernetes scheduler works best when it knows what resources a pod needs. It can then assure that it places pods on nodes where the resources are available. When designing your network, consider how many nodes can fail before the remaining nodes can no longer run all of the desired resources. Using a service such as a cloud autoscaling group will make recovery quick, but be sure that the remaining nodes can handle the increased load for the time that it takes to bring the failed node back online.
Kubernetes Services
All of the components that make up a Kubernetes Master or Worker, including etcd, are critical to the health of your applications. If any of these fail, the monitoring system needs to detect the failure and either fix it or send an alert.
Internal Services
The final layer is that of the Kubernetes resources themselves. Kubernetes exposes metrics about the resources, and we can also monitor the applications directly. Although we can trust that Kubernetes will work to maintain the desired state, if it’s unable to do so, we need a way for a human to intervene and fix the issue.
Monitoring with Rancher
In addition to managing Kubernetes clusters running anywhere, on any provider, Rancher will also monitor the resources running inside of those clusters and send alerts when they exceed defined thresholds.
There are already dozens of tutorials on how to deploy Rancher. If you don’t already have a cluster running, pause here and visit our quickstart guide to spin one up. When it’s running, return here to continue with monitoring.
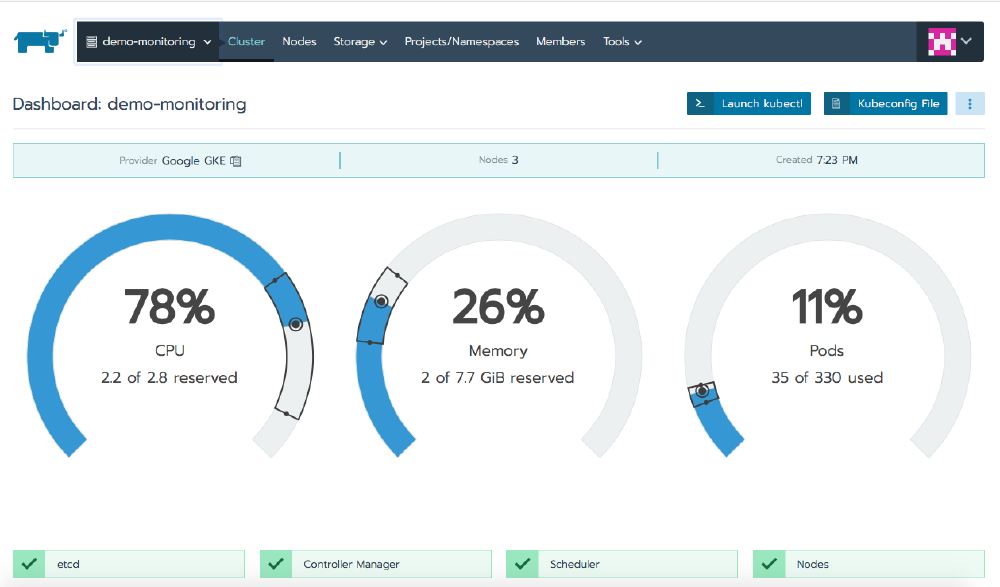
The cluster overview gives you an idea of the resources in use and the state of the Kubernetes components. In our case, we’re using 78% of the CPU, 26% of the RAM and 11% of the maximum number of pods we can run within the cluster.
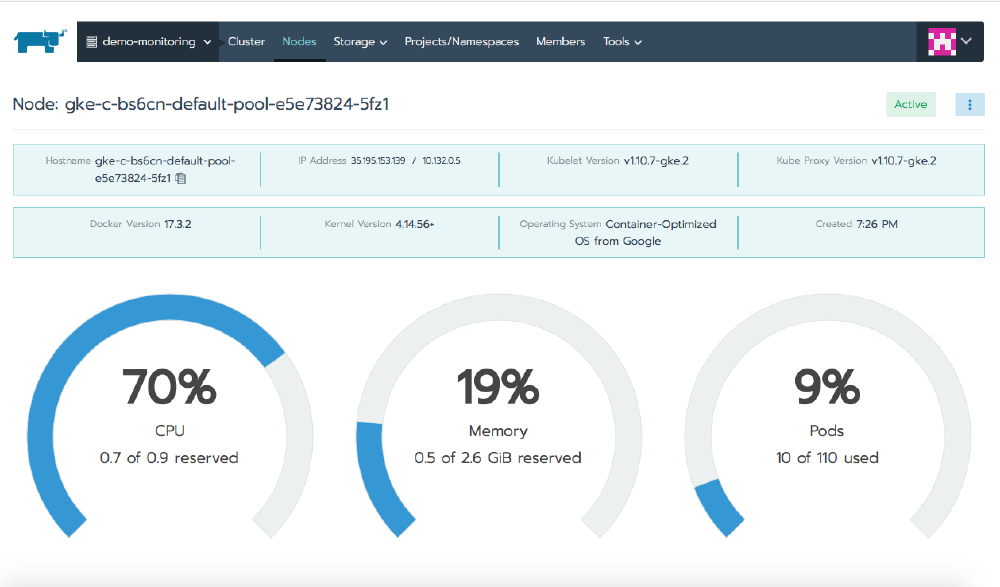
When you click on the Nodes tab, you’ll see additional information about each of the nodes running in the cluster, and when you click on a particular node, the view focuses on the health of that one member.

The Workloads tab shows the pods running in your cluster. If you don’t have anything running, launch a workload running the nginx image and scale it up to multiple replicas.
When you select the name of the workload, Rancher presents a page that shows information about it. At the top of this page it will show you each of the pods, which node they’re on, their IP address, and their state. Clicking on any individual pod takes us one level deeper, where now we see detailed information about only that pod. The hamburger menu icon in the top right corner lets us interact with the pod, and through this we can execute a shell, view the logs, or delete the pod.
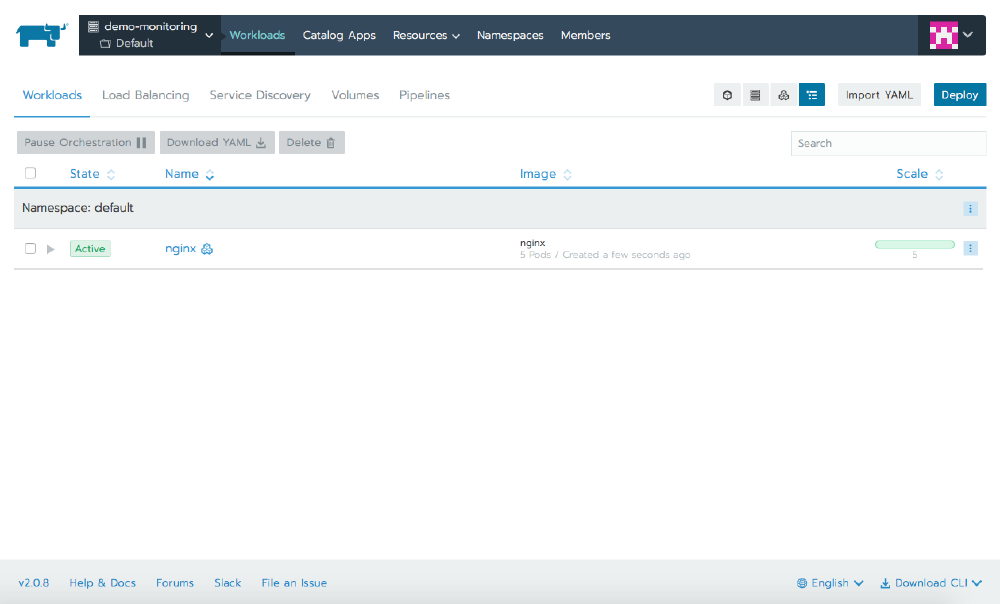
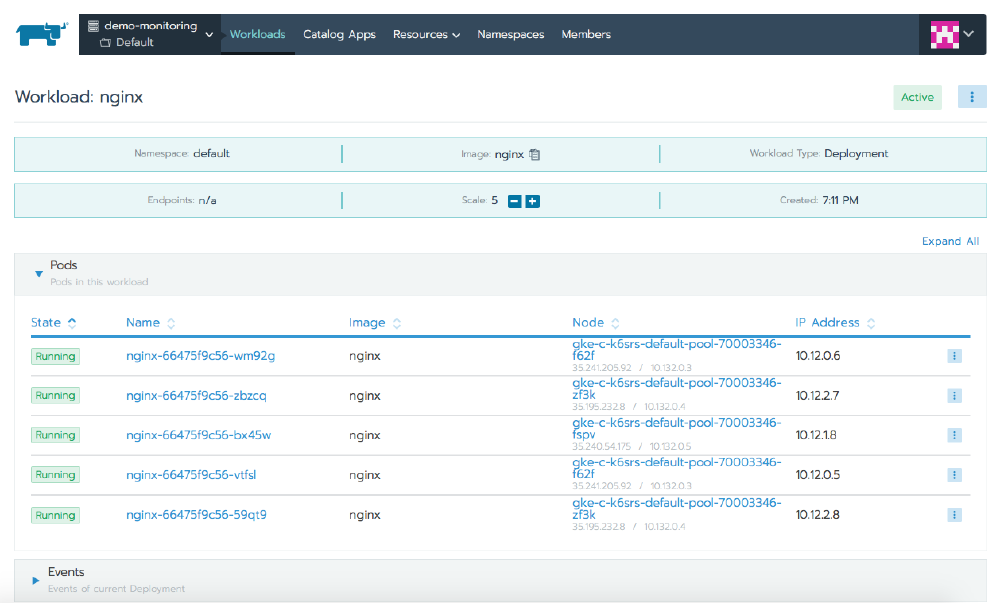
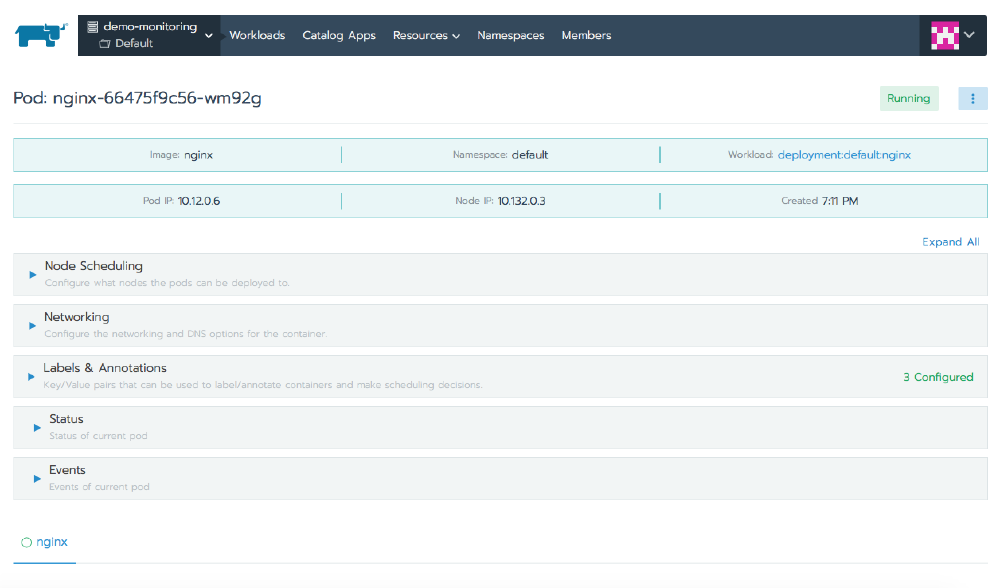
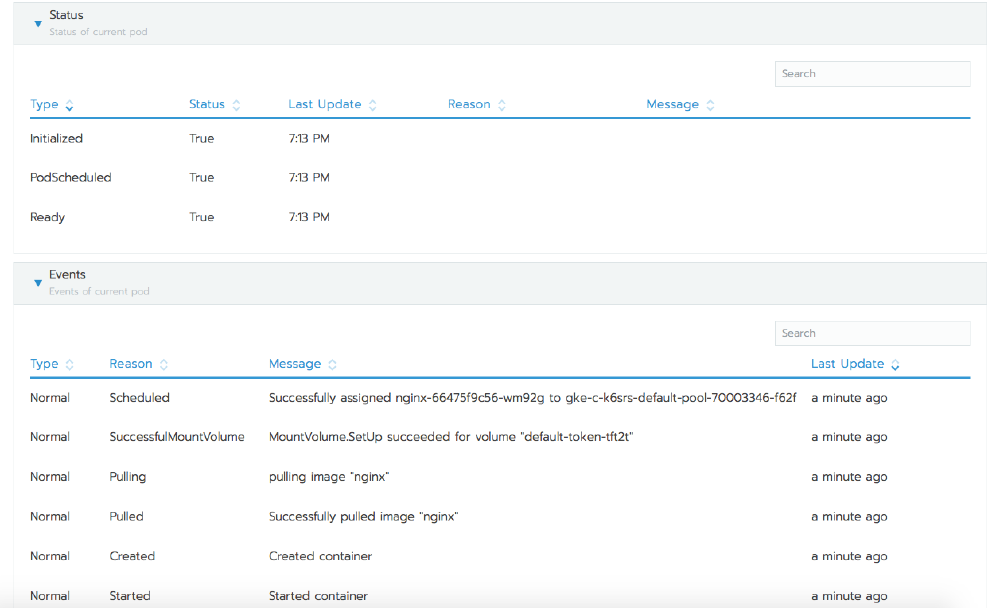
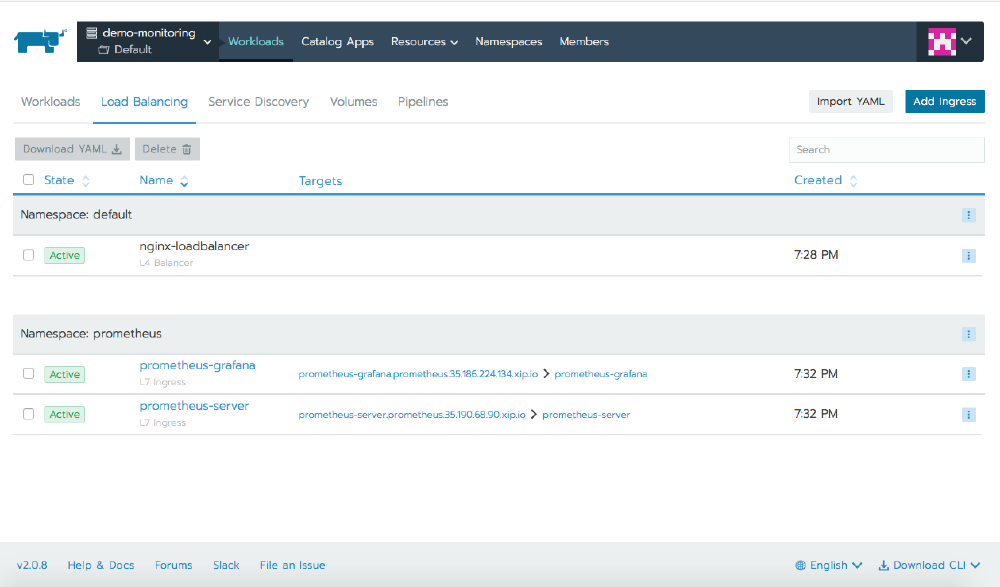
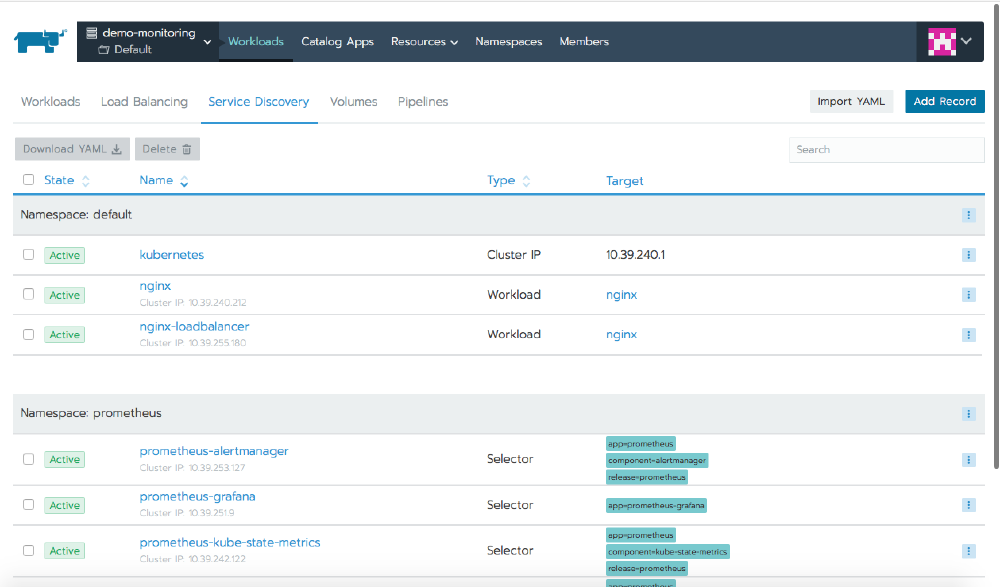
Other tabs show information about different Kubernetes resources, including Load Balancing for ingress or services of type LoadBalancer, Service Discovery for other service types, and Volumes for information about any volumes configured in the cluster.
Use Prometheus for Monitoring
The information visible in the Rancher UI is useful for troubleshooting, but it’s not the best way to actively track the state of the cluster throughout every moment of its life. For that we’ll use Prometheus, a sibling project of Kubernetes under the care and guidance of the Cloud Native Computing Foundation. We’ll also use Grafana, a tool for converting time-series data into beautiful graphs and dashboards.
Prometheus is an open-source application for monitoring systems and generating alerts. It can monitor almost anything, from servers to applications, databases, or even a single process. In the Prometheus lexicon it monitors targets, and each unit of a target is called a metric. The act of retrieving information about a target is known as scraping. Prometheus will scrape targets at designated intervals and store the information in a time-series database. Prometheus has its own scripting language called PromQL.
Grafana is also open source and runs as a web application. Although frequently used with Prometheus, it also supports backend datastores such as InfluxDB, Graphite, Elasticsearch, and others. Grafana makes it easy to create graphs and assemble those graphs into dashboards. Those dashboards can be protected by a strong authentication and authorization layer, and they can also be shared with others without giving them access to the server itself. Grafana makes heavy use of JSON for its object definitions, which makes its graphs and dashboards extremely portable and easy to use with version control.
Rancher includes both Prometheus and Grafana in its application catalog, so we can deploy them with a few clicks.
Install Prometheus and Grafana
Visit the Catalog Apps page for your cluster and search for Prometheus. Installing it will also install Grafana and AlertManager. For this article it’s sufficient to leave everything at its defaults, but for a production deployment, read the information under Detailed Descriptions to see just how much configuration is available within the chart.
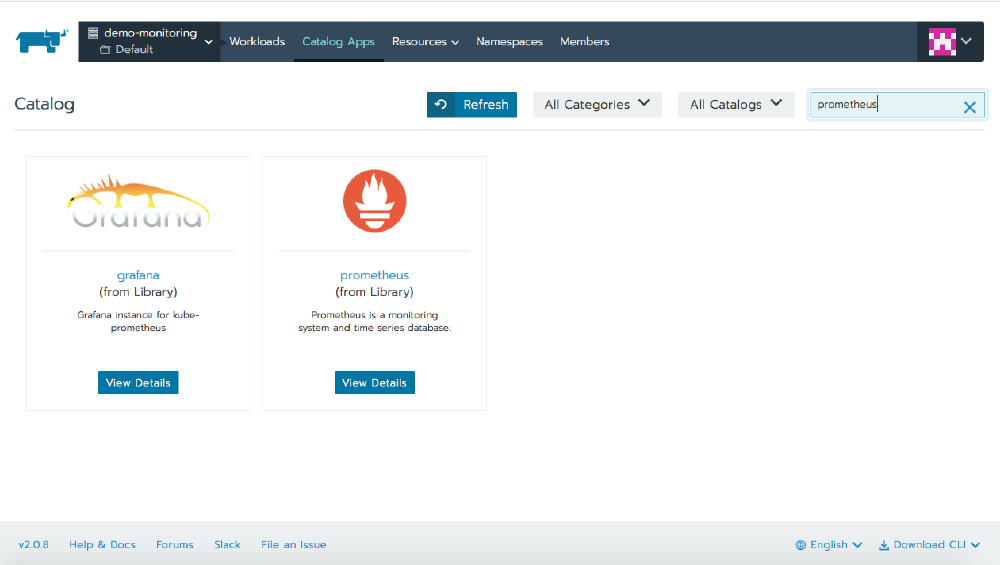
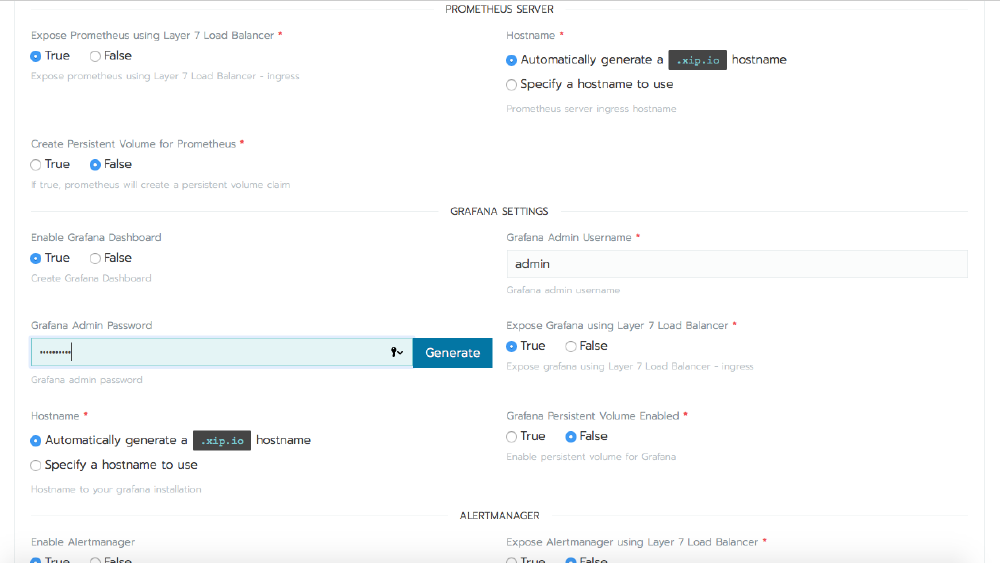
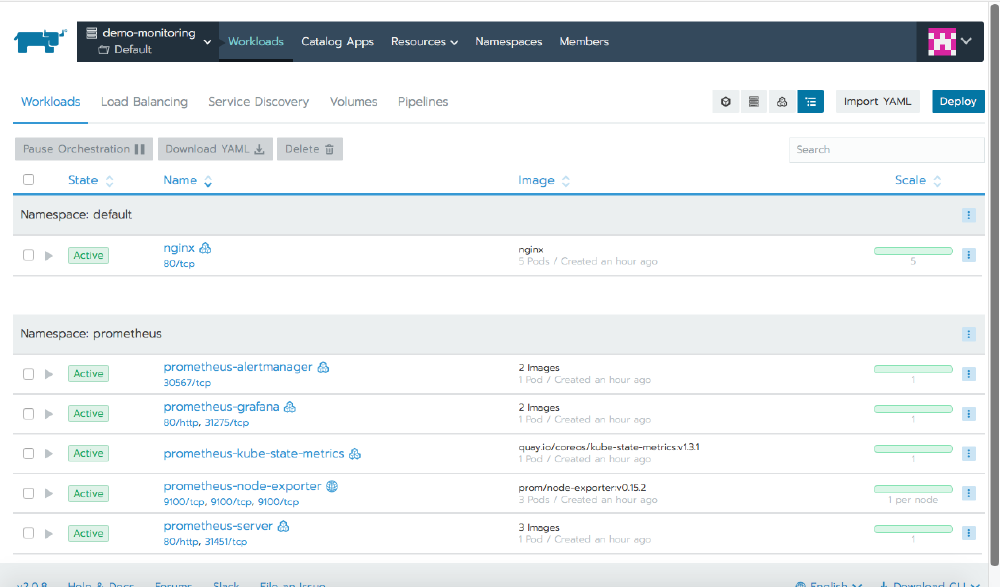
When you click Launch, Rancher will deploy the applications into your cluster, and after a few minutes, you’ll see all of the workloads in an Active state under the prometheus namespace.
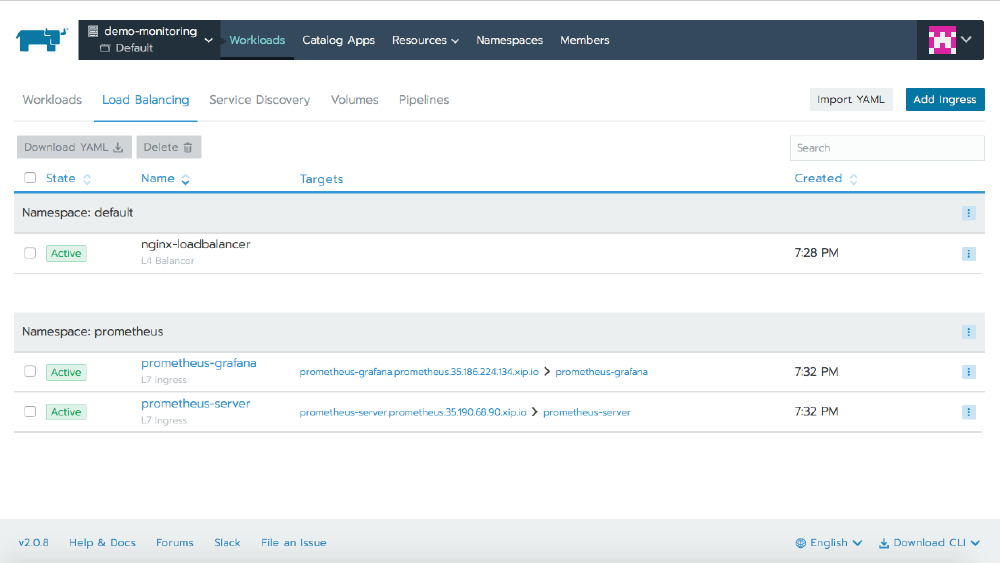
The defaults set up a Layer7 ingress using xip.io, and we can see this on the Load Balancing tab. Clicking on the link will open the Grafana dashboard.
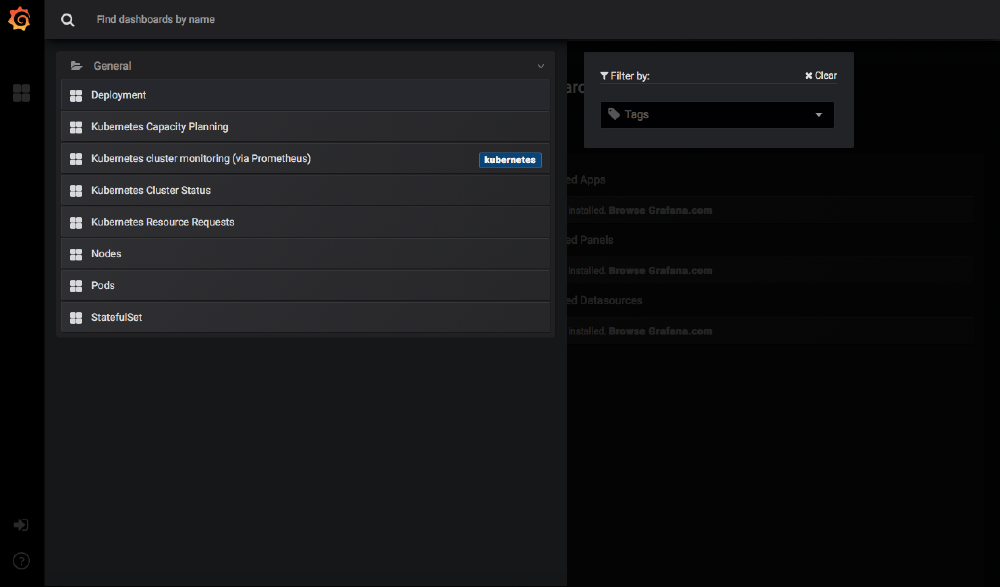
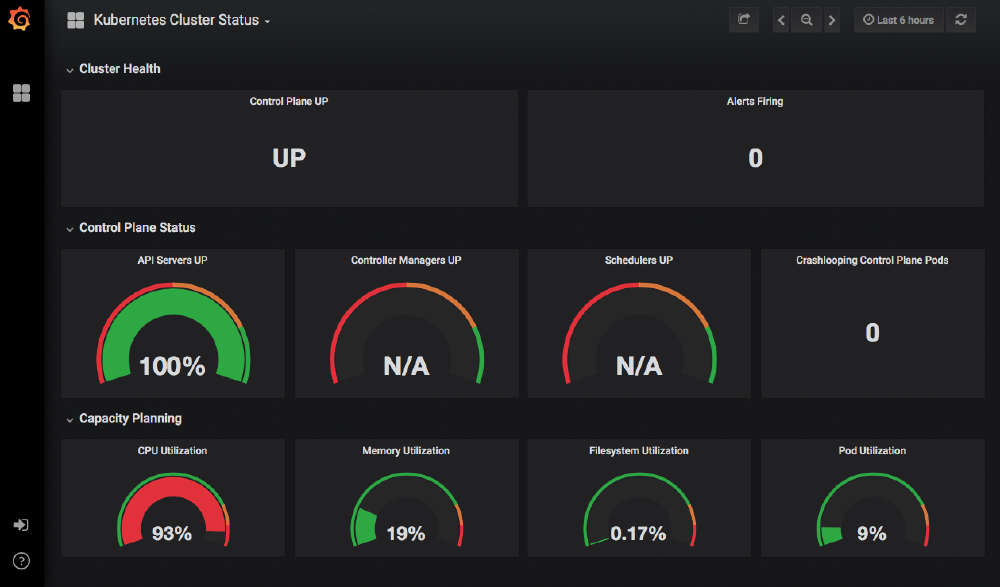
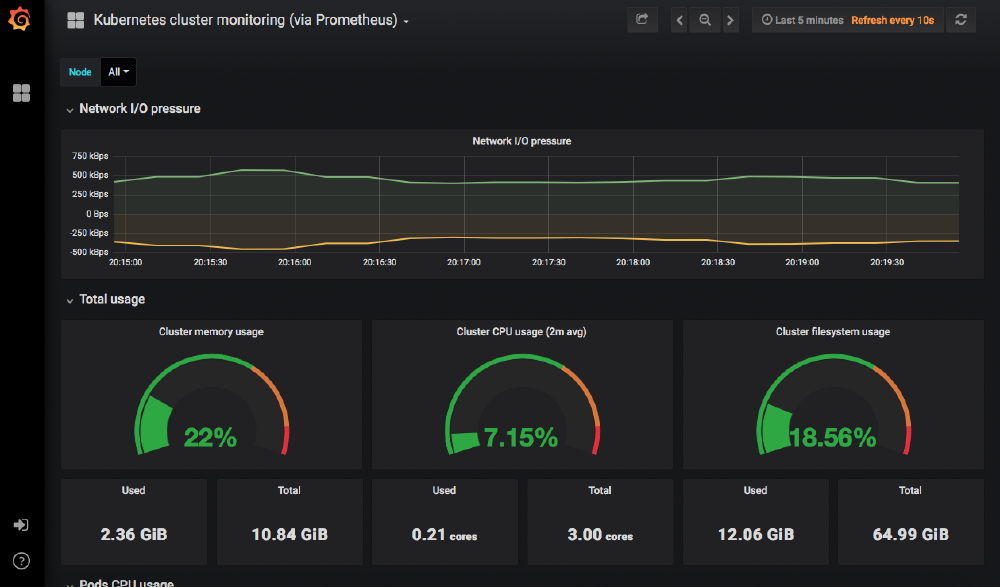
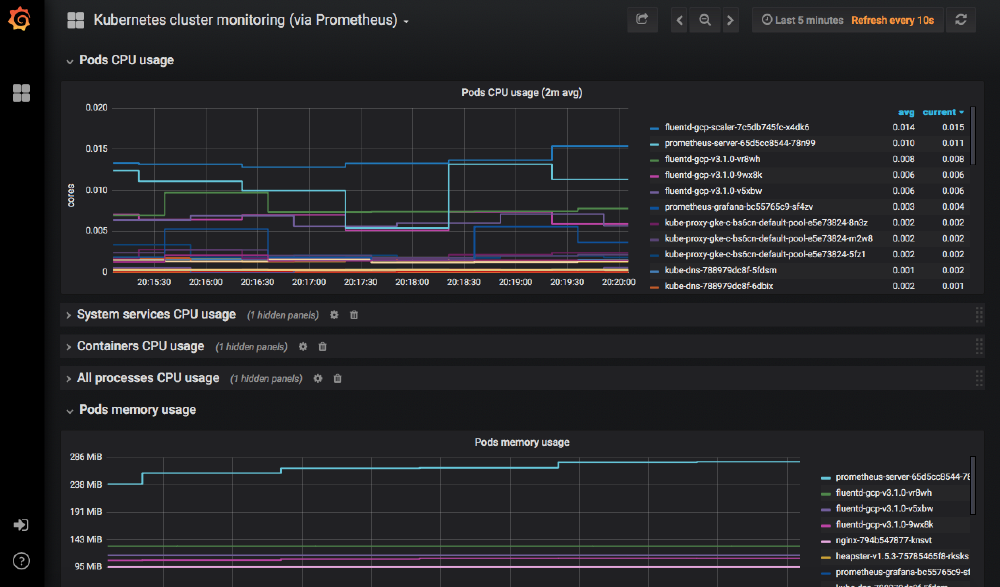
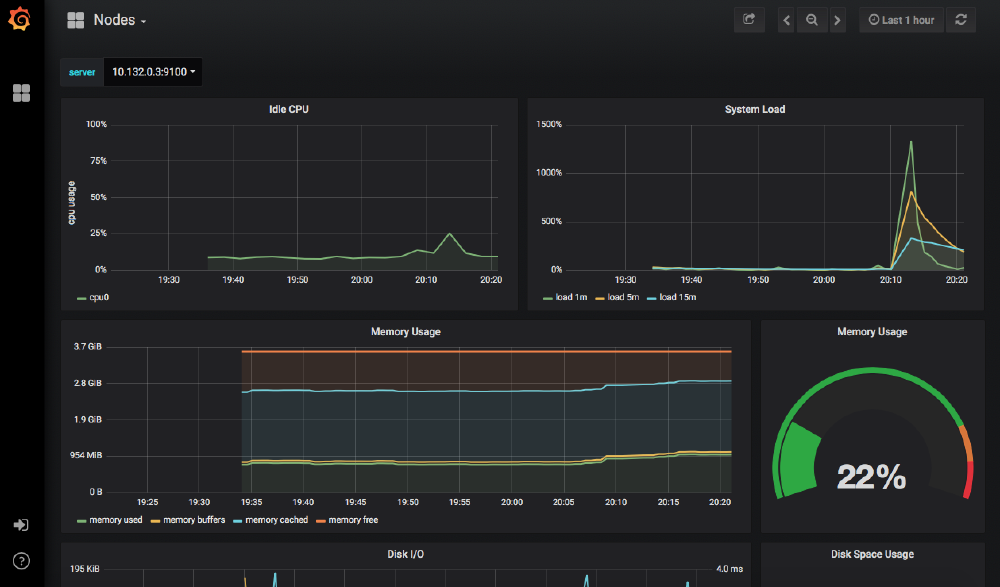
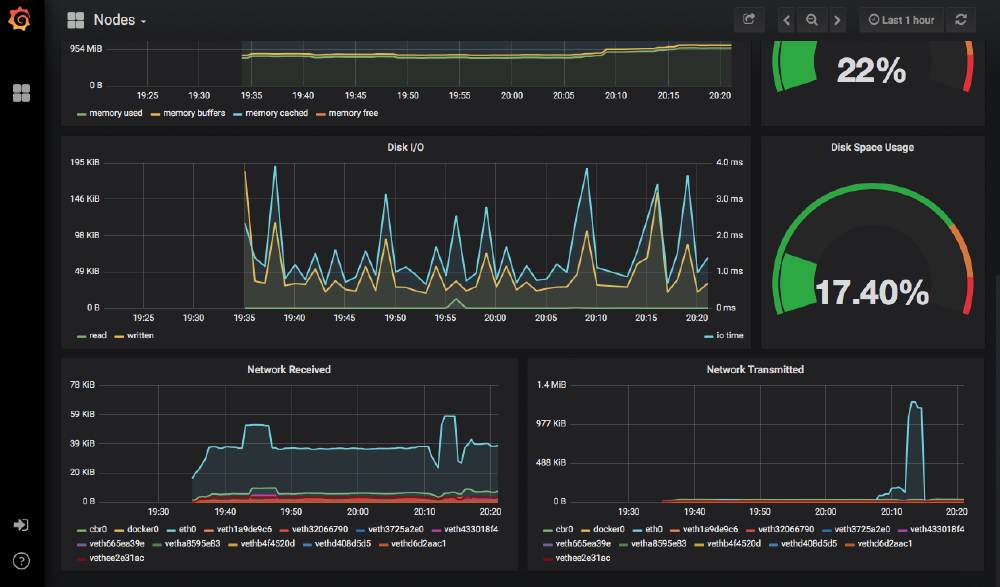
The Prometheus installation also deployed several dashboards into Grafana, so immediately we can see information about the cluster and start to view its performance over time.



Conclusion
Kubernetes works tirelessly to keep your applications running, but that doesn’t free you from the obligation of staying aware of how they’re doing. As soon as you begin to rely on Kubernetes to do work for you, the responsible thing to do is deploy a monitoring system that keeps you informed and empowers you to make decisions.
Prometheus and Grafana will do this for you, and when you use Rancher, the time it would normally take to deploy these two applications is reduced to mere minutes.
Related Articles
Jan 05th, 2024