Managing Ceph with Ceph Dashboard
With the release of SUSE Enterprise Storage 6, users can now take advantage of the advances made in Ceph Nautilus and the Ceph Dashboard, a snappy upgrade that makes managing and monitoring your storage cluster easier than ever.
Download this white paper to learn more.
The browser-based Ceph Dashboard provides a single point of contact for viewing and managing Ceph components and resources such as:
- Overall cluster health
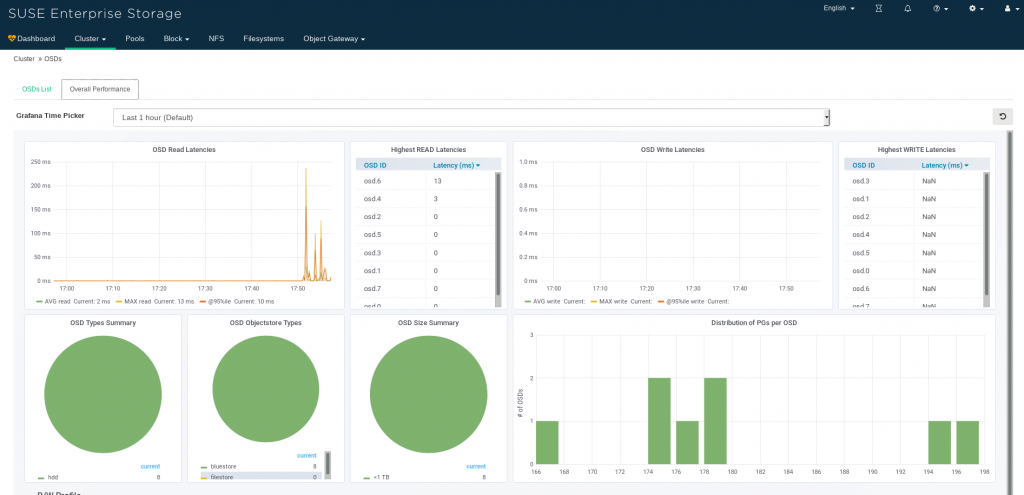
- Cluster logs and performance counters
- Hosts, monitors, pools, ODSs and object gateways
It also includes easy-to-use Prometheus-based monitoring tools that display graphs and information about the health and performance of the cluster.
Ceph Dashboard provides many new features demanded by modern enterprises that weren’t previously available:
- Administrators can set up users and roles with specific privileges, and that user information is shared across all ceph-manager instances of the cluster.
- New auditing support gives administrators a view of who did what and whether changes were made from the dashboard or via the REST API.
- Administrators can offload Ceph Dashboard authentication to an external single sign-on (SSO) service that supports the SAML 2.0 protocol and has been tested against KeyCloak and Shibboleth.
- The dashboard’s web interface has been translated into a variety of languages following I18N standards. This makes it easier for Ceph users in non-English speaking countries to manage and monitor Ceph using a more familiar language.
The Ceph Dashboard’s convenient, menu-driven management environment is a powerful reason why SUSE Enterprise Storage is a preferred Ceph platform for storage admins accustomed to performing management tasks within a GUI environment instead of a command-line interface.
Related Articles
Feb 17th, 2023
SUSE Linux Enterprise Micro 5.4 Public Beta (Beta 2) is out!
Nov 29th, 2022
No comments yet