Coming soon: SAP Landscape Monitoring on SLES for SAP
SAP Monitoring will become easier and powerful using SLES for SAP
As announced by Christian Holsing on this blog post, SLES for SAP Applications product will soon provide a new set of SAP monitoring and automation capabilities.
Today I would like to dive a bit deeper into the monitoring capabilities that are being introduced.
It is not a secret that SAP Landscapes can be really complex, especially in very critical environments that demand a high-level of availability and therefore deployment of clustered applications.
Another important component of complexity is the constantly growing demand for data and real-time information. That has been transforming the traditional system administration of a single central system into complex management of many systems distributed sometimes globally.
To support this new reality, the SUSE solution for SAP Landscapes monitoring introduces a data-driven approach. It uses the capabilities of Prometheus and Grafana to implement a central middleware that ingests, stores and provides common and standard interfaces for data consumption to introspect these systems.
If you already have your monitoring solution in place, but still want to take advantage of these new monitoring capabilities, Prometheus and Grafana have a wide range of plugins and projects to provide integration. They support many other applications like Nagios or Icinga, Public Cloud providers dashboards, and also library support for many languages in case of custom development.
If you want to have a deeper understanding of this solution, I recommend watching the SUSECon Session Monitoring highly available SAP clusters with Prometheus and Grafana [CAS-1088].
How to start?
The solution is composed of 3 main components: SAP and HA Cluster specific exporters, Prometheus Server and Grafana Server.
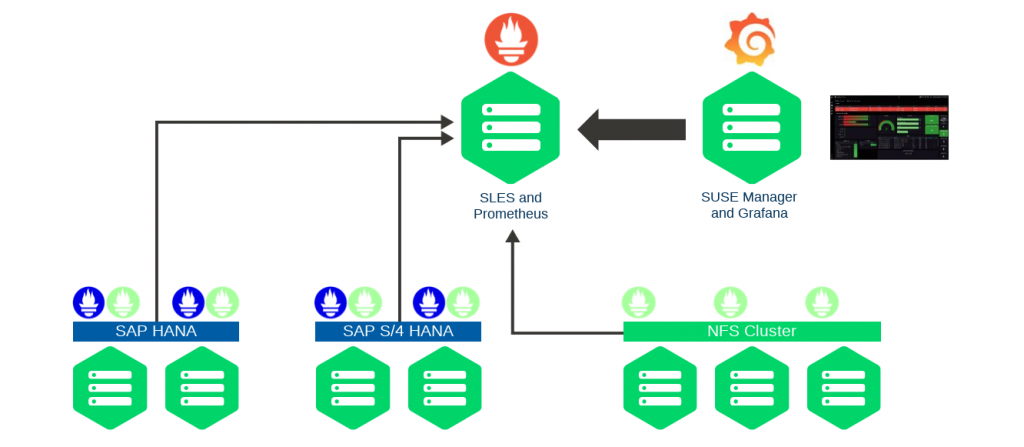
Prometheus and Grafana are available and supported by SUSE as part of the SUSE Manager version 4 release and the installation can be done automatically via SUSE Manager or manually.
To collect the data from the applications, three new Prometheus exporters were introduced:
SAP HANA Database Exporter
SAP HANA has an internal monitoring mechanism that collects data and stores it into database views. This exporter queries this data from these monitoring views and exposes it for Prometheus scrapping. It provides metrics about memory, CPU, disk, data files consumption, system replication status, I/O and Networking statistics, Tablespaces sizes, Top resource-consuming SQL statements, and others. More information available on the upstream repository https://github.com/SUSE/hanadb_exporter.
SAP Host Exporter
This exporter extracts the monitoring metrics provided by sapcontrol on SAP Netweaver, S/4 HANA and even HANA database nodes. It provides metrics about the status of processes started by the SAP Start framework, Enqueue Server Statistics, Dispatcher queue metrics, and others (check the full list here: https://github.com/SUSE/sap_host_exporter/blob/master/doc/metrics.md).
HA Cluster Exporter
This exporter extracts monitoring metrics for the components of the SUSE High Availability Extension offered as part of the SLES for SAP Application. If you have your SAP application protected by the SUSE clustering solution, using this exporter you can get metrics about Pacemaker nodes and resources status, Corosync ring and quorum metrics, SBD devices status, DRBD status and sync metrics, and more (check the full list here https://github.com/ClusterLabs/ha_cluster_exporter/blob/master/doc/metrics.md).
You can also complement the monitoring coverage with the complete coverage of the OS metrics, systemd services status, filesystem status, and many others using the node_exporter already available on your SLES for SAP repositories.
The SAP and HA Cluster exporter will be part of the SLES for SAP subscription and are currently available as part of the SLE-15-SP2 beta program, that will be generally available at the end of July.
They are provided via RPM packages named prometheus-hanadb_exporter, prometheus-sap_host_exporter and prometheus-ha_cluster_exporter. The installation instructions can be found on the mentioned upstream repositories or on the readme provided on the RPM package.
You can also deploy it automatically using the new salt automation formulas for SAP, but it is a topic for yet another blog post. ?
If you read until this point and are eager to start using it, you can get community RPM packages from this repository on openSUSE build service. You can also build it from source following the instructions available on the repositories documentation.
Just to finish this blog post with great news, we are working also to backport and release these exporters soon on the SLES for SAP Applications 12 SP3 and upwards. It will give you the ability to monitor also your already existing SAP Landscapes.
We hope you enjoy it!
Related Articles
May 05th, 2022
SUSE Manager 4.3 Public Beta is out!
Jun 08th, 2022
SUSE HA for SAP HANA scale-up cost-optimized improved
Jul 13th, 2022
No comments yet