AI Observability: Now Available With SUSE AI
If you’ve ever embarked on the journey of implementing or scaling AI within your company you’ve likely learned that using AI models, especially with agentic workloads, can be inherently complex. The same input might not always produce the exact same output; they are oftentimes a “black box” This inherent opacity makes understanding their internal decision-making processes, identifying performance bottlenecks, or troubleshooting unexpected behavior incredibly challenging. Wouldn’t it be nice to have observability into these AI “black boxes?”
Observability into these “black boxes” has been an uphill battle, a struggle that IDC attributes to the fact that more than 50% of PoCs never make it into production. But now that’s changed. As announced at SUSECON ’25, SUSE AI has released into general availability its AI Observability Dashboards, bringing insightful insights and visibility to your AI workloads.
Building on a Solid Foundation: Extending SUSE Observability
SUSE’ Observability has a powerful 4T Data Model, which provides a complete picture of your IT infrastructure and applications. Let’s briefly recap the 4Ts:
- Telemetry: This is the collection of essential data points like logs (detailed records of events), metrics (numerical measurements over time, such as CPU utilization or request rates), and events (discrete occurrences like system reboots or configuration changes). It’s the raw data stream that tells you what is happening.
- Tracing: More than just individual events, tracing provides the full context of a user interaction or a system request. It tracks a single transaction as it propagates through multiple services and components, from the initial request to the final response. This lets you understand the path and dependencies of a workflow.
- Topology: Visualizing complex systems has always been a challenge. Topology changes that and provides a dynamic visual representation of all the elements that exist within your environment (servers, databases, microservices) and how they interact with each other. It’s the map of your infrastructure.
- Time: Critical for historical analysis and trend prediction, the ‘Time’ dimension allows you to monitor both current, real-time activities and delve into past events. Providing this context helps you understand trends, diagnosing intermittent issues, and capacity planning.
SUSE AI Observability builds on SUSE Observability – extending these capabilities with specialized instruments and provides insights specifically for the unique demands of AI workloads. This includes deep monitoring of critical layers such as:
- AI Workloads: The core compute processes driving your models
- LLM Management: Specific metrics related to prompt engineering, token usage, and model response quality.
- Vector Databases: Performance and health metrics for specialized databases used in retrieval-augmented generation (RAG) and search.
- Base AI Components: Underlying infrastructure like Kubernetes clusters for orchestration and GPU management for compute acceleration.
The result? Intuitive visualizations specifically designed for generative AI workloads – in essence: Observability into that black box.
Unlocking ROI and Mitigating Risk
The stakes for AI adoption are incredibly high. But with only 44% of PoCs making it into production, it’s clear that AI workloads must be properly managed – from optimization of costs to utilization of resources. SUSE AI Observability directly addresses these critical business concerns.
Control Costs: Token and Resource Optimization
One of the most immediate and impactful benefits of AI Observability is its ability to directly influence your budget. As your AI initiatives scale and more users interact with your models, particularly with expensive LLMs, “token usage” becomes a direct cost driver. Every prompt, every response, every interaction consumes tokens, and these costs can rapidly spiral out of control if left unmonitored.
Without a clear window into token usage, how can you accurately budget for your AI operations? How do you prevent your current budget from being overrun? The simple answer is: you can’t. This lack of insight leads to unpredictable expenses and hampers strategic financial planning.
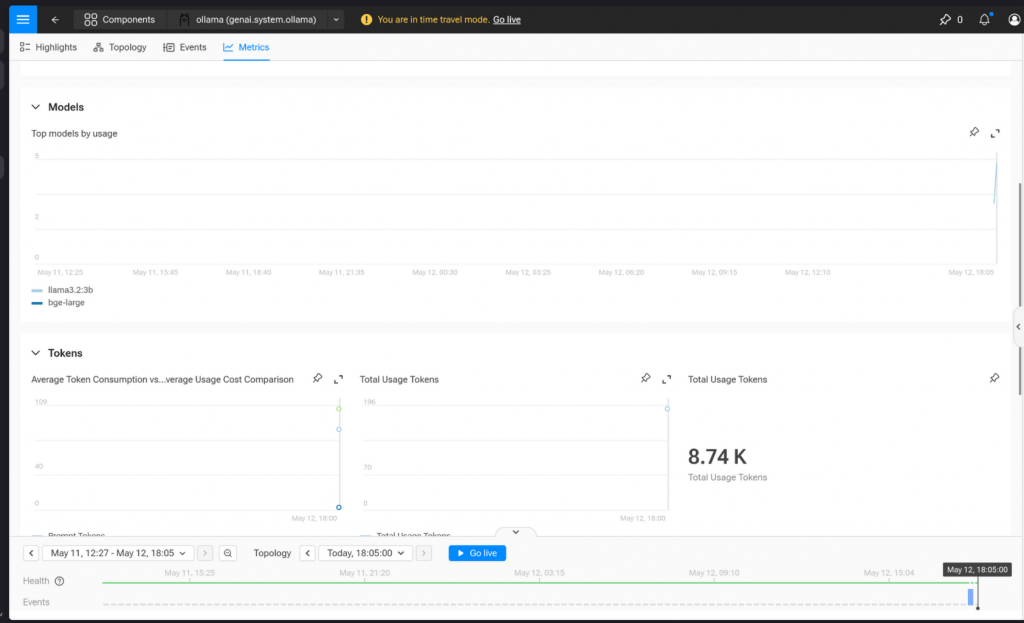
With SUSE AI Observability Dashboards, you gain real-time insight into:
- Token Consumption Rates: See exactly how many tokens are being used over time.
- Efficiency Metrics: Understand how effectively each token is being utilized, identifying wasteful patterns.
- Prompt-Specific Patterns: Analyze token usage across different types of prompts or user queries.
This information empowers your teams to refine prompts to use fewer tokens, or route requests to less expensive models. This level of control provides the data needed for robust financial planning and forecasting.

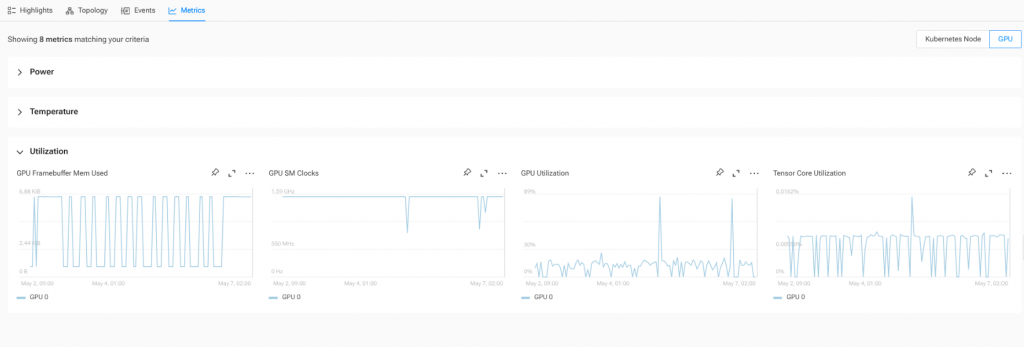
Beyond tokens, AI workloads are notoriously resource-intensive. You have to manage GPUs, CPUs, high-speed networking, and vast amounts of memory. This is complex and challenging; but not managing risks:
- Under-utilization: Paying for compute, memory, or storage that your AI models aren’t fully using.
- Over-utilization: Models performing poorly or jobs failing because they don’t have enough resources, leading to delays and wasted effort.
SUSE AI Observability provides insight into how these resources are being utilized, by which workloads, and for how long. This shift from a “one-size-fits-all” approach to precise, workload-specific resource allocation gives you a way to optimize your budget.

Proactive Issue Resolution
How do you handle performance issues when your AI workload is essentially a “black box”? Intermittent errors, sudden drops in model accuracy, or unexpected outputs can be extremely hard to trace back to their source.
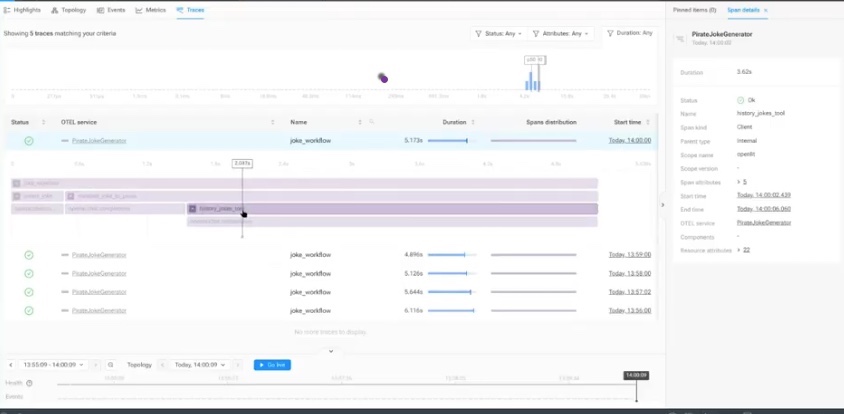
SUSE AI Observability provides the essential logs, metrics, and traces needed to identify the cause of performance bottlenecks, data anomalies, or unexpected model behavior. Because SUSE Observability’s 4T Data Model includes the Time dimension, you not only get real-time insights but also the ability to analyze historical data. This “time machine” capability is invaluable for understanding trends, diagnosing intermittent issues that might not be present at the moment of inspection, and determining precisely when an incident occurred.
By detecting anomalies and potential issues early, observability helps prevent small problems from escalating into major incidents. This is crucial because unresolved AI issues can lead to significant financial losses—whether due to slow or incorrect decisions, missed business opportunities, or severe reputational damage stemming from erroneous or biased AI responses.

Informed Decision-Making
Beyond the day-to-day operational benefits, SUSE AI Observability fundamentally transforms how organizations approach strategic AI investments. By providing clear, data-driven insights into both performance and costs, the new SUSE AI Observability dashboards will help organizations understand the ROI of their AI initiatives. This data is critical for making informed decisions about where to invest further and where to scale back.
You’ll also gain historical data from AI Observability on resource usage and workload patterns. This will help with more accurate capacity planning and scaling infrastructure appropriately with demand – without unnecessary over-provisioning or costly last-minute expansions
The SUSE AI Observability dashboards are installed via the SUSE Application Collection, readily available within the SUSE AI Stack.
The era of “black box” AI is coming to an end. SUSE AI Observability gives you transparency, control, and insights necessary to manage your AI workloads effectively. This will maximize their value, optimize your costs, and ensure responsible, reliable AI operations at scale.
For more information or to book a demo, visit https://suse.com/products/ai.
Related Articles
Nov 12th, 2025